Fixed Income Insights
In a nutshell
US labour market: cooling or cracking?
- The US labour market shows signs of deceleration, with private sector payrolls experiencing slight declines, excluding healthcare, due to demographic trends
- Cyclical job growth remains stagnant, defying historical patterns, while weak hiring rates increase vulnerability to potential unemployment spikes
- Immigration declines have lowered workforce growth, potentially reducing breakeven payroll estimates and reshaping labour supply dynamics
- Wage growth has softened, with lower earners and younger workers disproportionately affected, highlighting uneven economic adjustments
- AI adaption is reshaping the labour market, automating entry-level roles and contributing to rising graduate unemployment and underemployment
- Ultimately, the labour market remains central to shaping market expectations and the Fed's policy direction. Signs of significant weakness in employment could lead to a repricing of rate expectations and heightened volatility across asset classes
AI's impact on credit markets
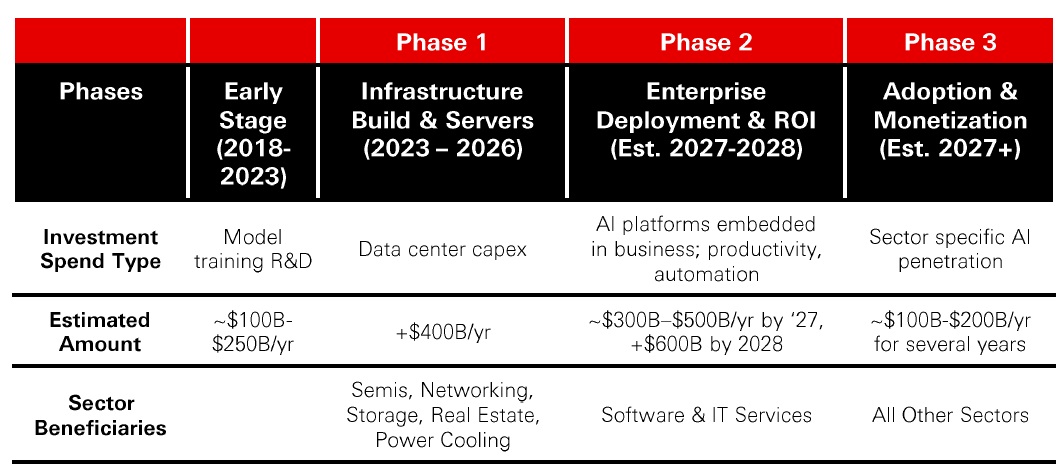
- The generative AI investment cycle is unfolding in three phases: infrastructure build-out, enterprise deployment and broad adoption and monetisation
- Hyperscalers and driving significant capital expenditure, projected to reach USD 400bn in 2025, benefiting sectors like semiconductors, real estate, and power infrastructure
- Despite increased reliance on external financing, hyperscalers maintain strong credit fundamentals, with manageable debt levels and robust free cash flow
- Enterprise adoption of AI is expected to double the software market to USD 2tn by 2029, though challenges like unmet expectations and pilot failures persist
- Regulatory approaches to AI vary globally, with Europe leading in structured frameworks, while US-China trade restrictions influence the strategic landscape
- The rapid pace of AI investment, comparable to the early 2000s telecom boom, raises questions about long-term returns and the financial risks of overinvestment
Source: HSBC Asset Management, October 2025.
US labour market: cooling or cracking?
The US labour market is in a "curious equilibrium" combining low hiring, low firing, soft employment growth and broadly stable unemployment. This leaves it vulnerable to any further weakening of demand, which in turn would have implications for risk assets.
Whether the US labour market is merely cooling or on the cusp of "cracking" remains an open question. Understanding the underlying trends is made more difficult by the lack of official data, reflecting the prolonged government shutdown. The unusual nature of this cycle, with the hangover from the pandemic shaping outcomes which do not fit historical patterns, further complicates the situation.
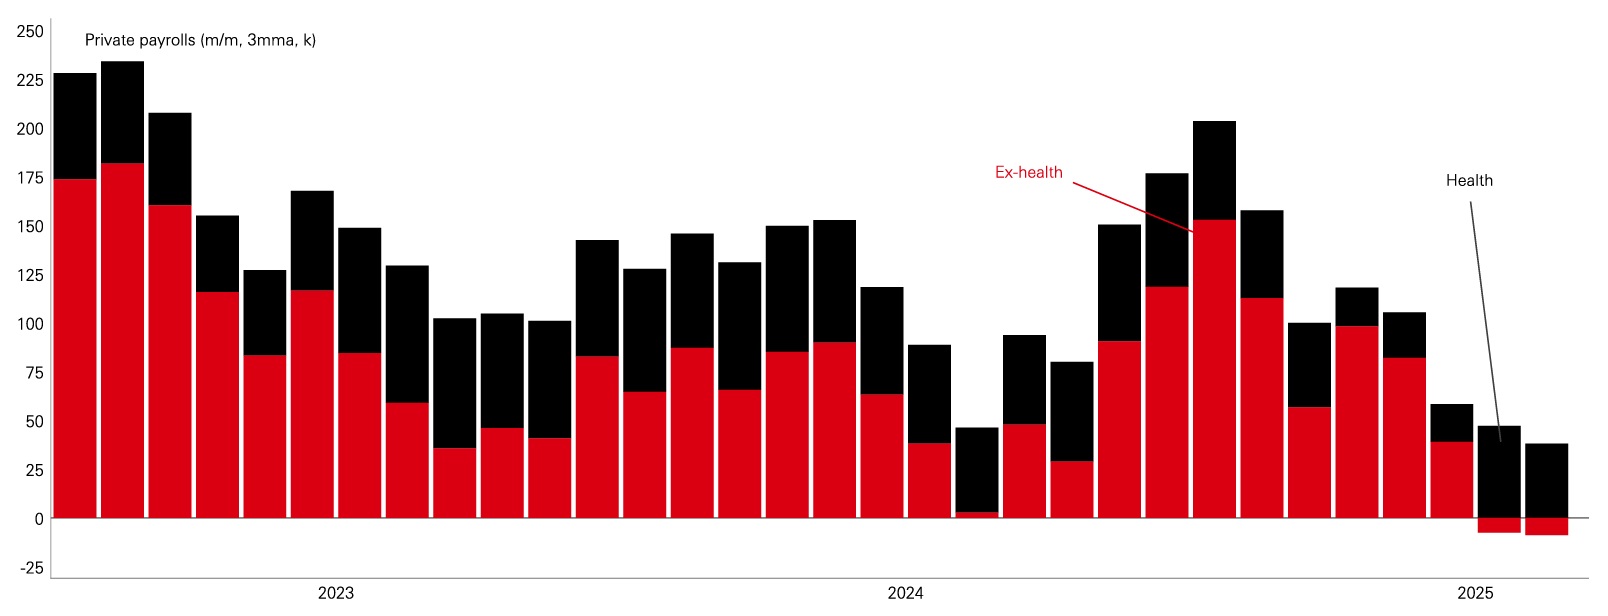
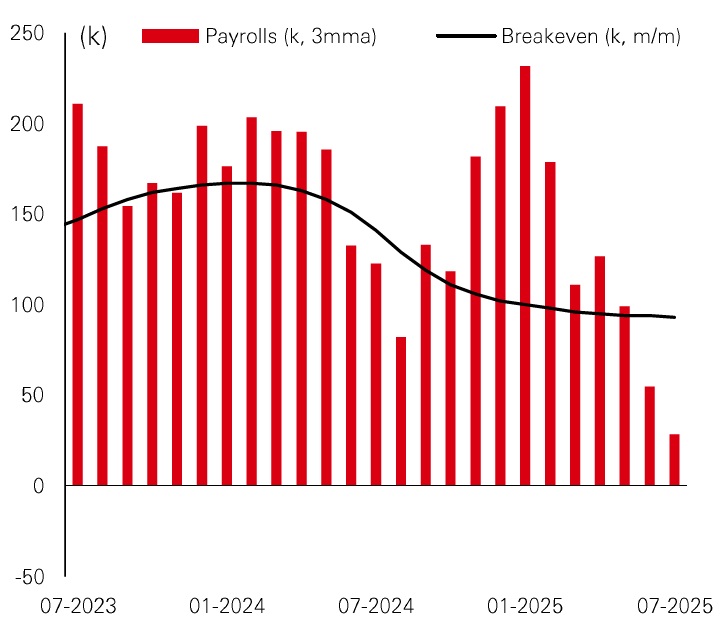
The last official print, covering August, shows payrolls growth slowed markedly over the summer. On a three-month moving basis, private-sector employment rose by a little under 3Ok. Excluding healthcare, which continues to expand due to long-running demographic forces, private sector payrolls fell slightly over the summer months. Moreover, the Bureau of Labour Statistic's provisional benchmark revisions, which are yet to be reflected in the monthly data, suggest total payrolls in the 12 months to March 2025 were around 73k per month weaker than initially estimated.
Figure 1: Soft-patch or sustained slowdown?
Click the image to enlarge
Source: Macrobond, HSBC AM, October 2025.
While official employment figures for September and October are not available, the privately-produced ADP employment numbers provide a reasonable alternative measure. These data show private payrolls fell in September but recovered in October, averaging less than 10k across the two months.
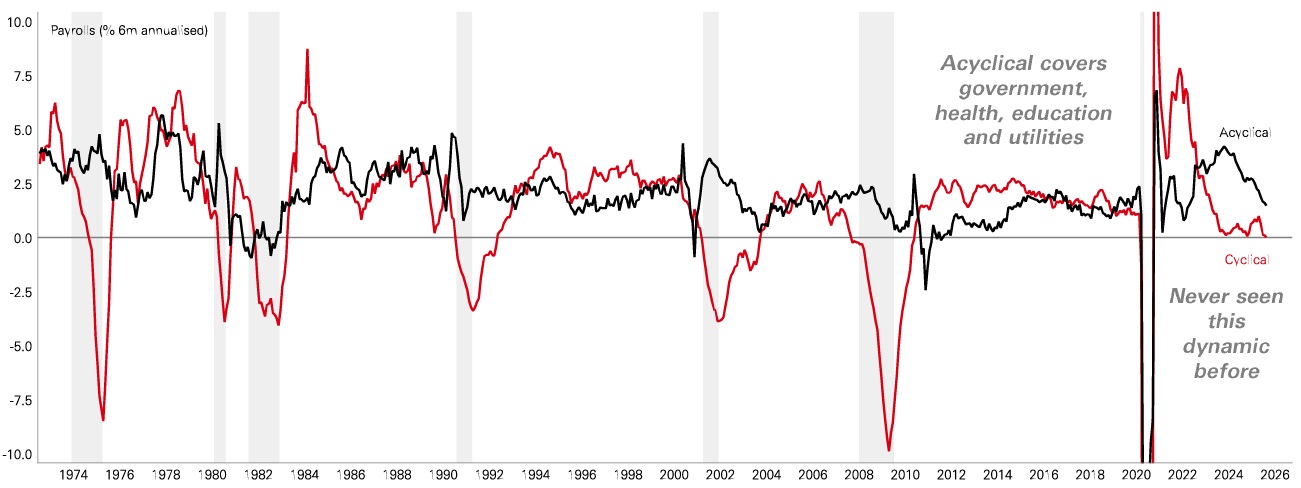
The current weakness of jobs growth needs to be seen in the context of what is proving to be an unusual period for the labour market. Cyclical employment growth - which excludes government, healthcare, education and utilities jobs - has been running at an unusually low rate for some time. Lacklustre employment growth is a function of depressed hiring and separations rates, which Federal Reserve Chair Powell has referred to as a "curious equilibrium" and one that may not be stable.
Cyclical jobs, covering most private-sector industries, normally increase strongly during upswings and reduce rapidly in recessions. This time, however, cyclical employment growth has been hovering a little above zero since late 2023. Such a prolonged period of stasis has no precedent. Typically, when cyclical jobs growth slows to around zero it goes on to contract sharply as a recession sets in. Yet so far, this has not materialised and it highlights the difficulty of reading this cycle using traditional frameworks, as the historical reference points do not neatly apply. Strong acyclical employment had been offsetting slower cyclical payrolls growth, but it to is now softening.
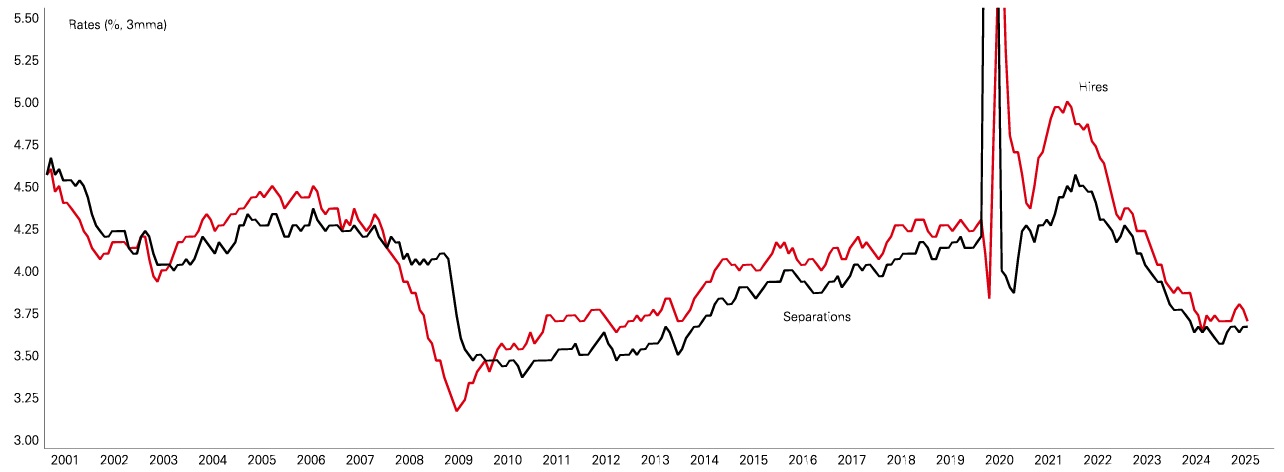
Adding to the unconventional pattern, hiring and separations have both been unusually subdued, resulting in the limited "net" gains in payrolls. The Federal Reserve has noted this dynamic, with Chair Jerome Powell emphasising that a persistently weak hiring rate makes the labour market vulnerable if layoffs rise. In such an environment, even a modest negative demand shock could cause unemployment to climb quickly. This lends weight to the 'stall-speed' narrative adopted by some policy makers, politicians and commentators who advocate a more dovish stance on interest rates.
Figure 2: How long can this be sustained?
Click the image to enlarge
Figure 3: Static labour market
Click the image to enlarge
Source: Macrobond, HSBC AM, October 2025. Past performance does not predict future returns.
The Trump administration's immigration crackdown explains part of the weakness in employment in recent months, as it has reduced labour force growth. Consequently, soft employment has not resulted in rising unemployment. Nonetheless, demand-side weakness is evident as job openings have declined and wage growth moderated, particularly at the lower end of the income spectrum and among younger workers.
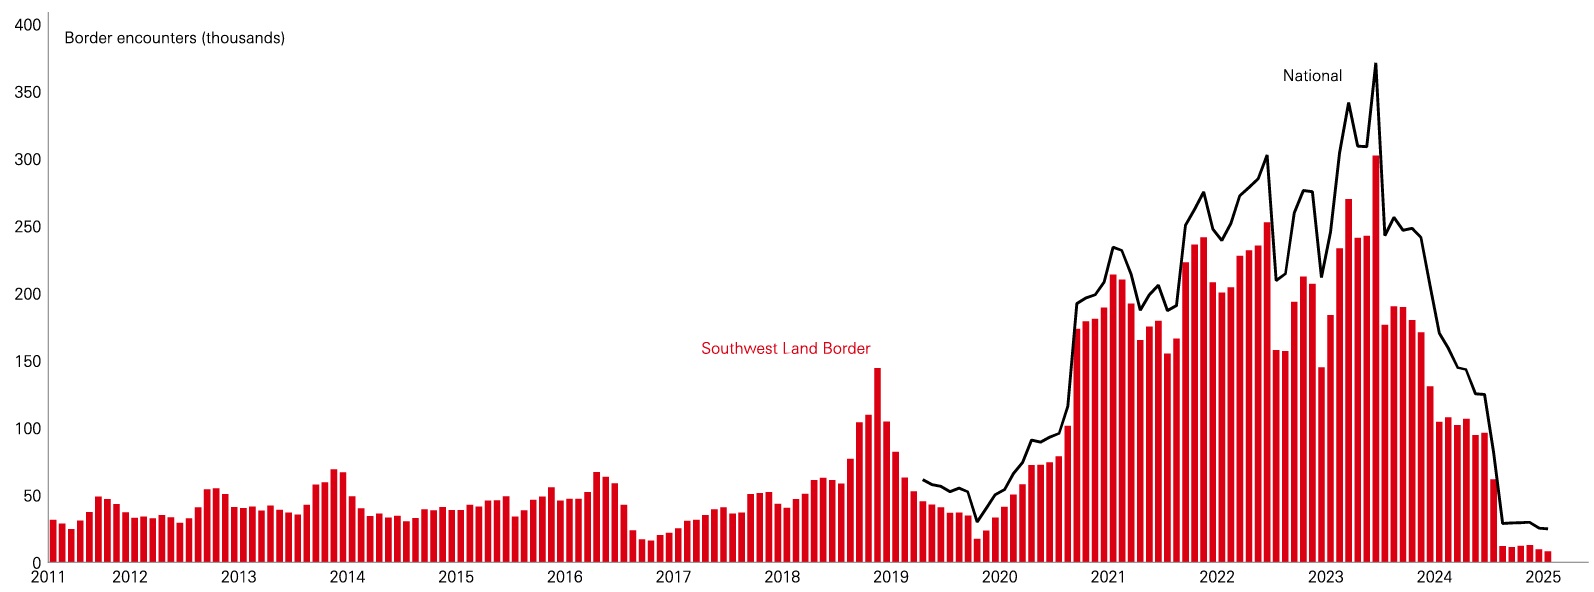
The Trump administration's crackdown on immigration has seen encounters at the Southwest Land border crossing — historically the most significant channel for illegal entries into the United States - slump to multi-year lows. This represents a marked turnaround from the post-pandemic surge and has reduced the supply of new workers entering the US labour market.
Figure 3: Labour supply shock
Click the image to enlarge
Source: Macrobond, HSBC AM, September 2025. Past performance does not predict future returns.
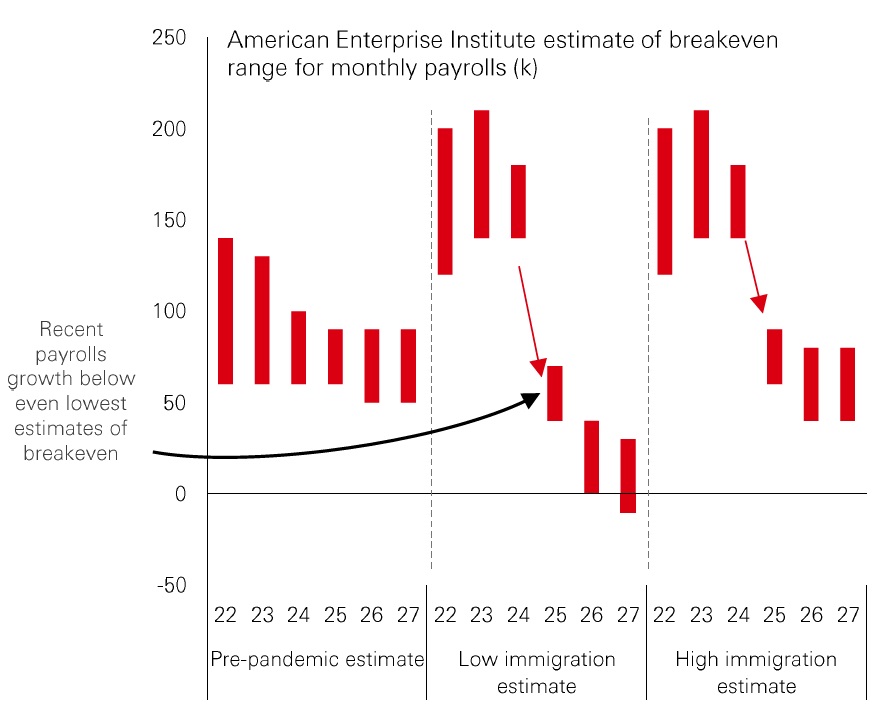
This supply-side development reduces breakeven payroll growth, the level of monthly job creation needed to keep unemployment steady. Before the pandemic, estimates had already been drifting lower, reflecting demographic changes such as an ageing population. Research from the likes of the American Enterprise Institute and Peterson Institute suggest that breakeven figure might be around 1OOk per month under normal immigration conditions. But with immigration now falling back, projections imply that breakeven growth could now be much lower, even potentially turning negative by 2027.
Figure 4: Breakeven payrolls growth below 100k per month
Click the image to enlarge
Figure 5: 2022-2024 immigration boost could reverse
Click the image to enlarge
Source: American Enterprise Institute, Jed Kolko, HSBC AM, October 2025. Past performance does not predict future returns.
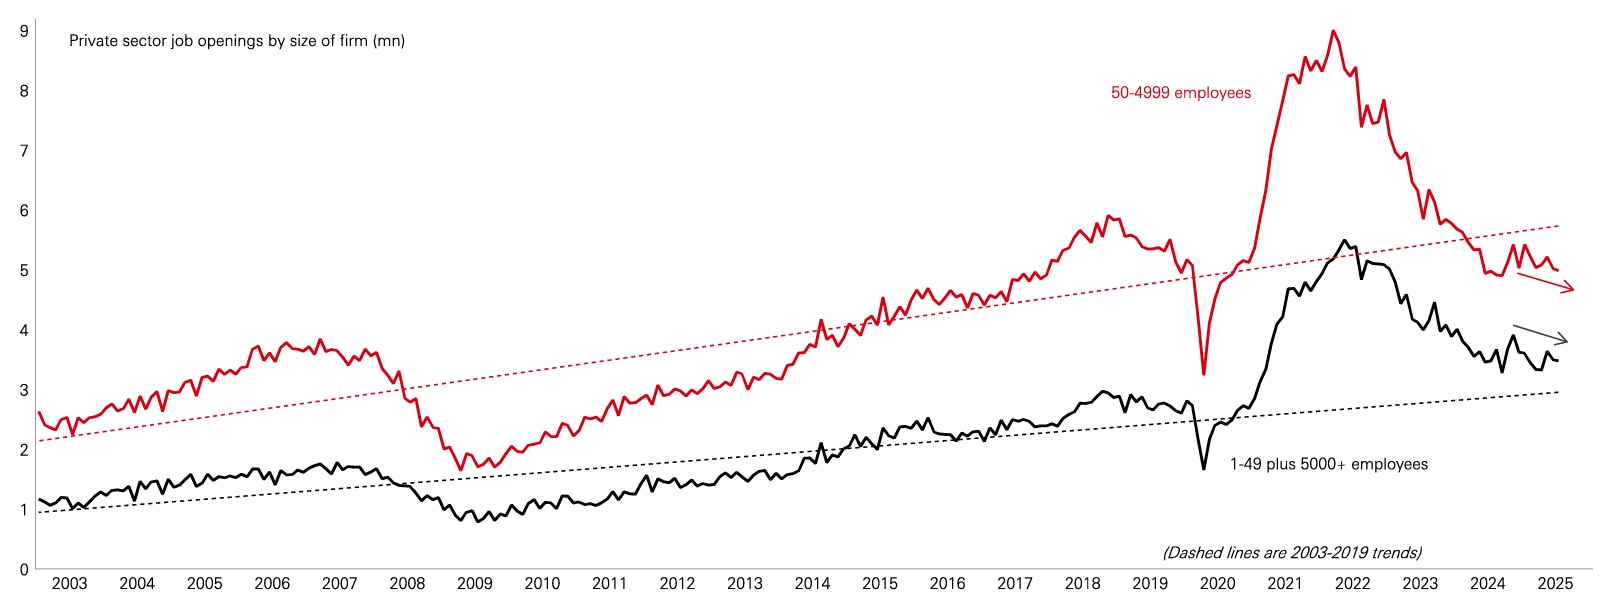
The most recent pace of payroll gains, however, has slipped below even the lower bound of these estimates for 2025, pointing to demand-side weakness. Weaker demand is echoed in surveys. Data from the Conference Board shows a spike in the number of consumers expecting fewer jobs to be available in the next six months, reaching levels historically seen before significant downturns. Job openings provide additional evidence. Very large companies, supported by strong cash positions, and the smallest firms still show openings slightly above trend. But vacancies at mid-sized to large firms, which employs the majority of workers, have fallen below trend, signalling broadening weakness.
Figure 6: Demand softening
Click the image to enlarge
Source: Macrobond, HSBC AM, October 2025. Past performance does not predict future returns.
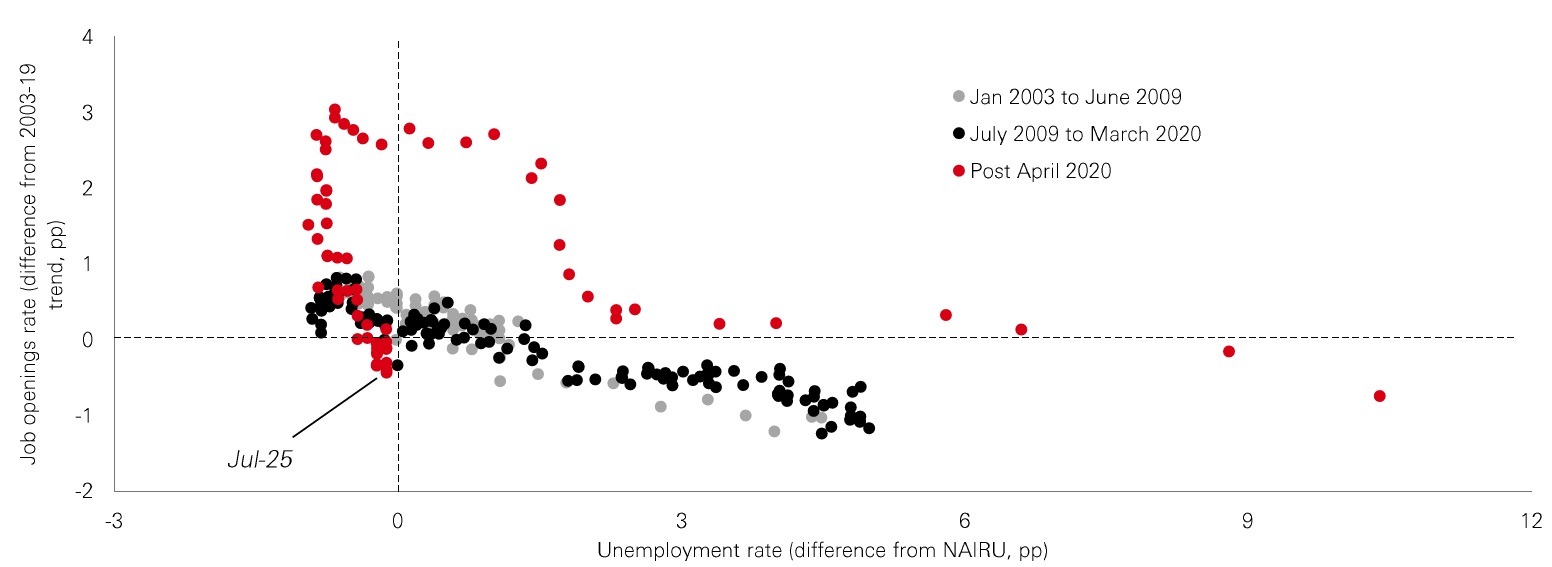
The Beveridge curve shows below-trend vacancies are usually consistent with higher unemployment, highlighting that the US labour market is in an unusual equilibrium and may be approaching 'stall speed', leaving it vulnerable to negative shocks — even a further limited drop in demand could cause unemployment to rise disproportionately.
Figure 7: Is the labour market approaching stall speed?
Click the image to enlarge
Source: Macrobond, HSBC AM, September 2025. Past performance does not predict future returns.
Wage growth has also softened, providing important information on the balance of demand and supply. The distribution across cohorts is telling. The lowest earners and younger workers - often overlapping groups - saw the fastest gains during the pandemic, but their wages are now growing below pre-pandemic levels. This stands in contrast to older age groups, where wages, while slowing, remain above pre-pandemic growth rates. The widening divergence suggests that the burden of adjustment is being felt disproportionately at the lower end of the pay distribution.
Figure 8: Wage growth of low earners slowing sharply...
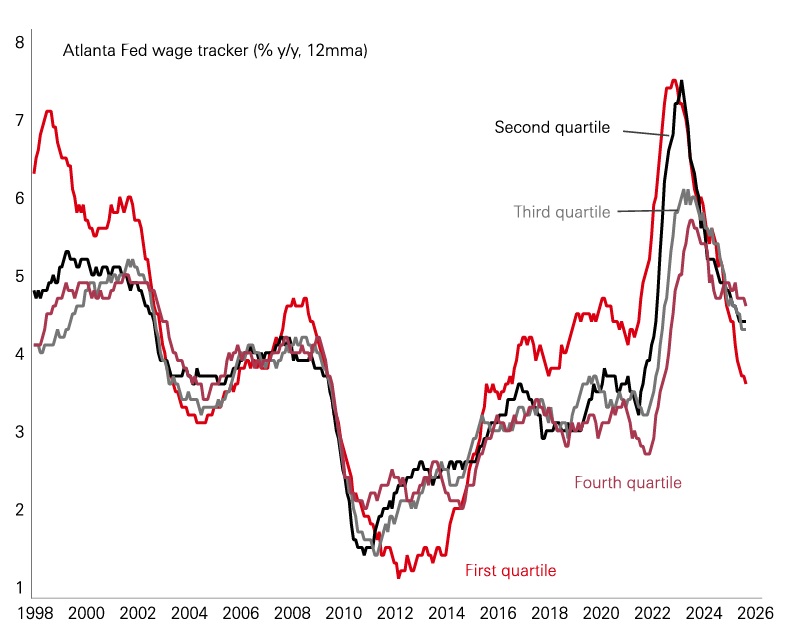
Click the image to enlarge
Figure 9: . as is wage growth of younger workers
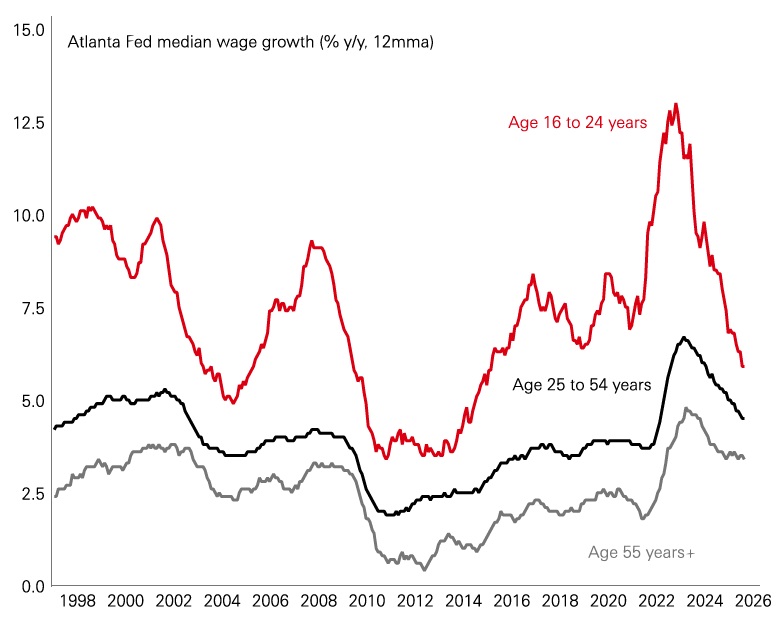
Click the image to enlarge
Source: Macrobond, HSBC AM, October 2025. Past performance does not predict future returns.
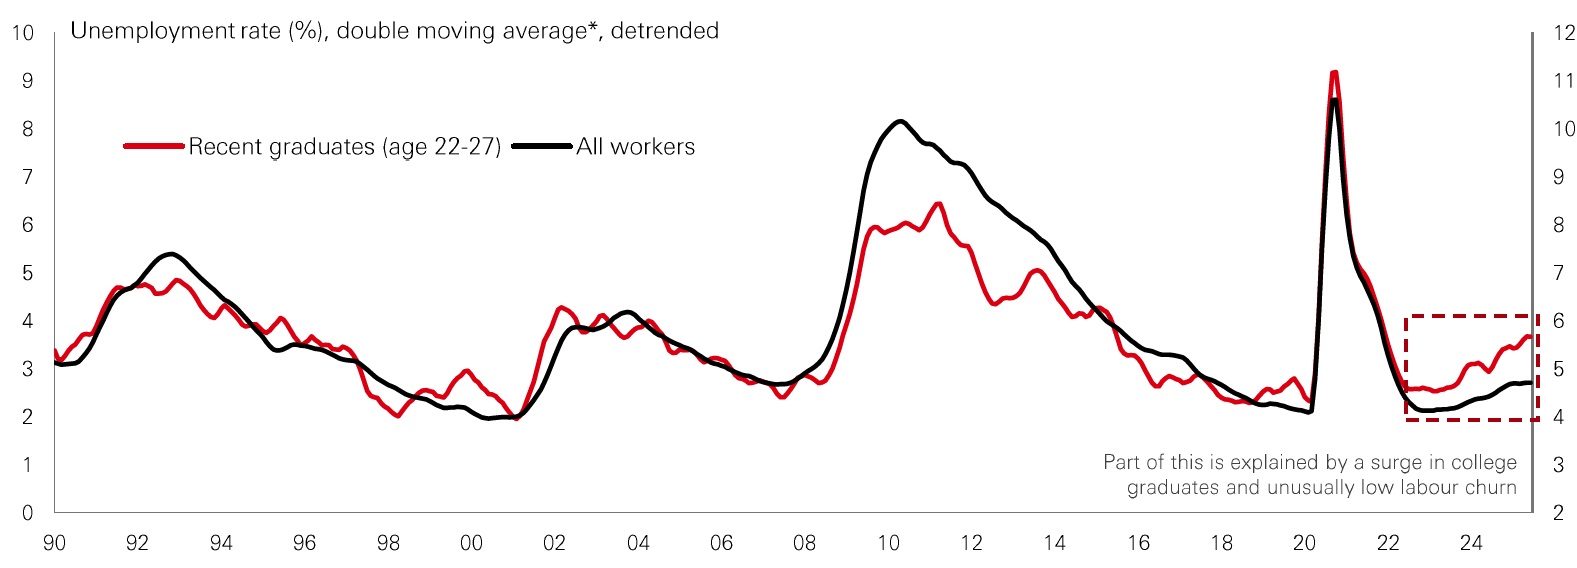
Al adoption may be reshaping the labor market, automating roles traditionally filled by graduates and contributing to rising graduate unemployment, with the tech sector itself leading the way in reducing hiring.
Uneven wage dynamics coincide with the rapid integration of artificial intelligence into corporate processes. Adoption has accelerated quickly: by mid-2023, roughly 10 per cent of US firms were using generative Al, up from just 7 per cent a quarter earlier. Sectors such as IT services, education and professional services led in adoption, investing heavily in both tools and training. The potential productivity benefits are significant, but the implications for the labour market are more complex.
Al has proven effective at tasks once performed by junior staff, including summarising documents, processing data, and debugging code. These roles have traditionally been the entry point for graduates, but they are now increasingly vulnerable to automation. This may be starting to impact graduate labour market outcomes. The unemployment rate for graduates has risen to 4.8 per cent as of June, consistently higher than the aggregate rate — a reversal of historical norms where higher education offered greater opportunity of employment. Under-employment has also climbed, with a larger share of graduates working in jobs that do not require a degree.
Figure 10: Al skill demand peaked in 2022, when ChatGPT released
Click the image to enlarge
Source: Federal Reserve Bank of New York, Brynjolfsson et al (2025), Dario Amodei (2025), Indeed Hiring Lab, Brooking Institution, OpenAI, HSBC AM, September 2025. *6-month trailing moving average applied to meta-series which is seasonally adjusted and smoothed using a 3-month moving average
This change may represent more than a short-term fluctuation. Rising graduate under-employment might be signalling that the supply of skilled labour is outpacing demand for graduate-level tasks, a mismatch now being reinforced by rapid technological change.
The technology sector embodies this paradox. Firms at the forefront of Al deployment are also reducing hiring, particularly in coding, testing and support roles that Al tools can substitute or augment. This follows a pandemic-era hiring surge, which is now unwinding. While Al is not the only factor behind this slowdown, its timing suggests it is reinforcing broader cyclical trends.
Ultimately, the labour market remains central to shaping market expectations and the Fed's policy direction. Signs of significant weakness in employment could lead to a repricing of rate expectations and heightened volatility across asset classes.
The overall picture for the US labour market remains finely balanced. Corporate profit growth remains solid, which typically supports employment and underpins the scenario of subdued growth rather than a sharp contraction. But the risks are clear: if weakening labour outcomes dampen consumption and feed back into profits, the balance could shift quickly. In such a case, what looks today like a cooling labour market could tip into a more pronounced downturn.
Indeed, the risk of a rapid deterioration prompted the Fed to cut the funds rate in October, despite persistent above-target inflation. The market is currently pricing further cuts down to 3.00-3.25 per cent by late next year. To go below this level is likely to require more concrete evidence that the labour market is "cracking". In the absence of such evidence, market expectations for Fed policy could remain in the region of 3.00-3.50 per cent with Treasury yields range bound.
Given a starting point of tight credit spreads and near-record high US equity prices, any marked deterioration in the labour market could present a problem for risk assets, as policy lags mean the Fed would be behind the curve.
AI's impact on credit markets
The risks of over expectation must be recognised for a technology that has yet to justify its extraordinary level of investment. While the hyperscalers currently face limited risks due to their strong credit fundamentals, firms involved in infrastructure build and servers are more exposed.
The investment cycle for generative Al can be broken down into distinct phases.
Click the image to enlarge
Source: HSBC AM, IDC, Standford, McKinsey, October 2025
The first stage of the Al investment cycle, initiated in 2023, is characterised by substantial capital expenditure from hyperscalers, spanning servers, networking, cooling, power and real estate. Hyperscalers' capital spending is projected to approach USD 400bn in 2025, more than 50 per cent above the prior year, with servers and chips accounting for the bulk of outlays.
Figure 1: Large scale spending through '28 and Capex likely be revised higher.
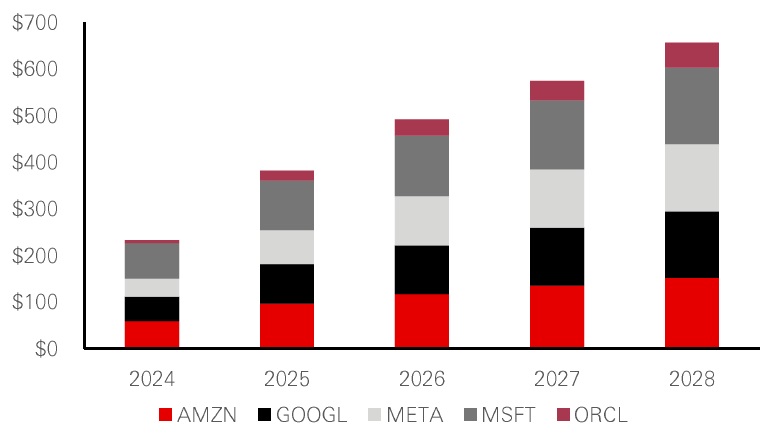
Click the image to enlarge
Figure 2: Al-related Data center infrastructure is driving most of Capex increase
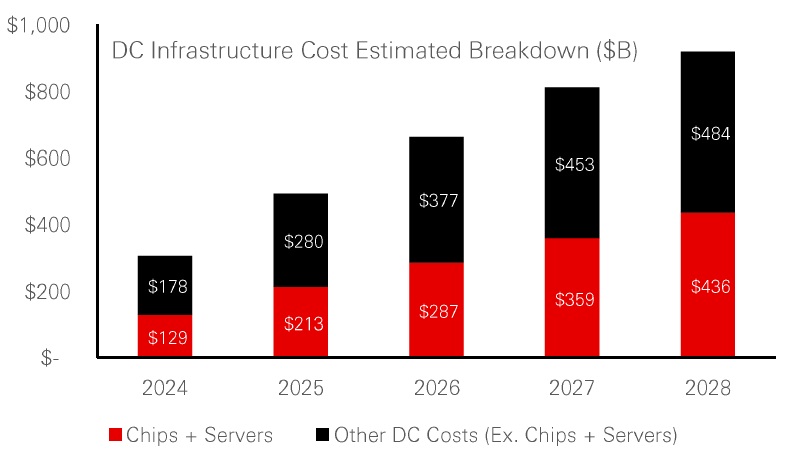
Click the image to enlarge
Sources: HSBC Asset Management, September 2025.
Demand is feeding into semiconductors, equipment manufacturing, cooling systems and power infrastructure. Consequently, semiconductor firms, construction companies and infrastructure providers will be prominent beneficiaries, along with data centre providers in different regions as geographic footprints expand.
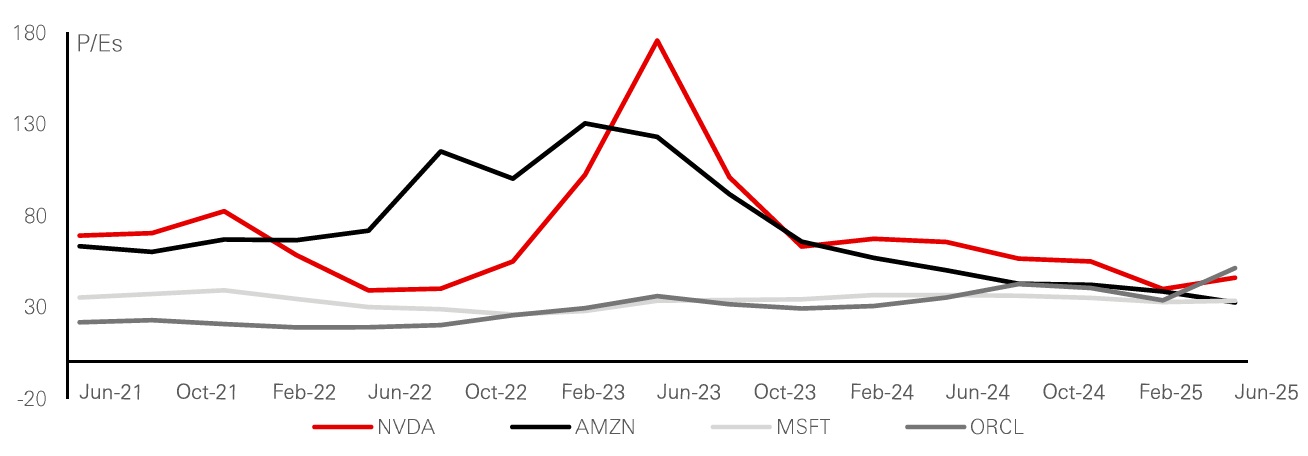
Figure 3: Free Cash Flow / Debt remains robust with ample cushion - aside from ORCL
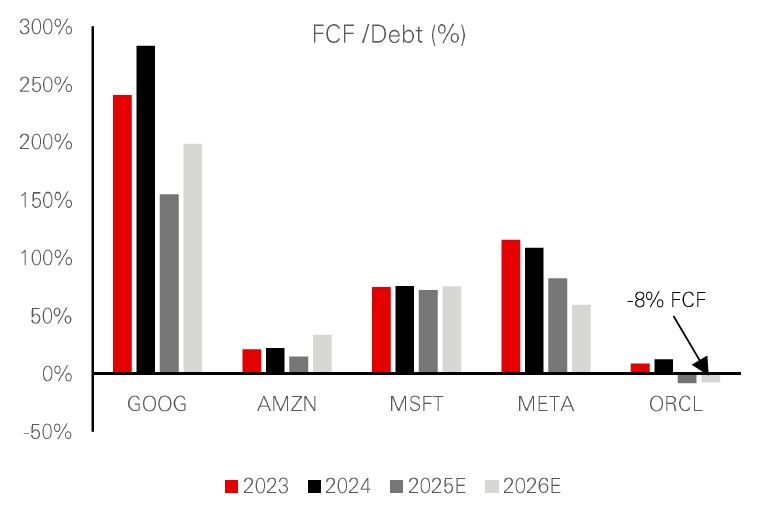
Click the image to enlarge
Figure 4: Even at USD 2.9tn in future spending by Hyperscalers, bond issuance is expected to remain manageable.
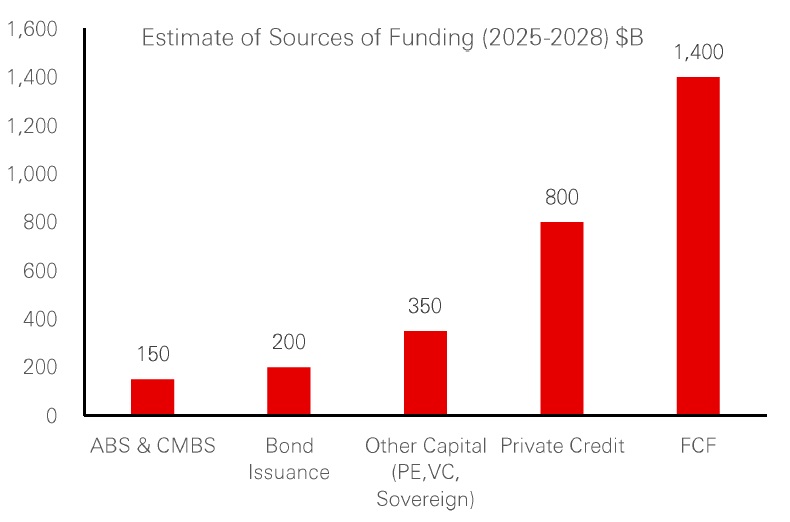
Click the image to enlarge
Source: HSBC AM, Morgan Stanley Research, October 2025.
The scale of commitments through 2028 - close to USD 3tn in projected capex — is gradually shifting the Hyperscalers' funding dynamics. Declining free cash flow has meant an increasing reliance on external financing, with bond issuance estimated at around USD 200bn through the period. Nevertheless, these companies enter this phase with high profitability and strong leverage metrics. Free cash flow to debt remains generally comfortable, and net leverage is low relative to rating agency downgrade triggers, apart from Oracle.
Tax policy introduced during the Trump administration has provided near-term relief. Allowances for immediate expensing of domestic R&D and 100 per cent depreciation of qualified capex have offset some pressure. But as these measures roll off, the funding balance may adjust, placing greater emphasis on debt markets. Nevertheless, revenue opportunities from Al are projected to expand significantly, with estimates reaching around 1 trillion in 2028. An early clue to success could be revenue growth estimates in software and services revised upwards next year.
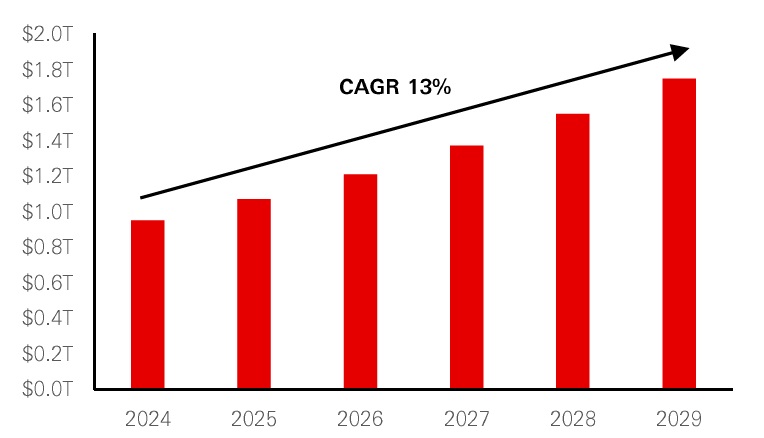
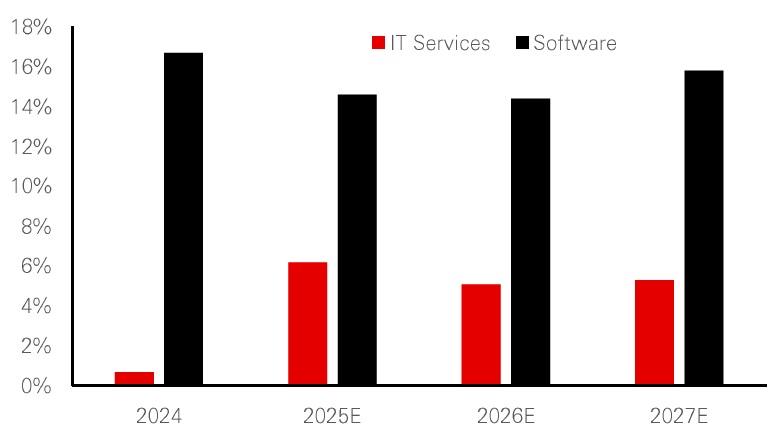
The second phase is expected to emerge when enterprise deployment of Al begins to generate measurable revenues. Software companies are positioned to capture these flows as adoption expands from experimentation to scaled usage. Projections suggest the total addressable market for software could double to USD 2tn by 2029. Pricing models will be a key differentiator: consumption-based structures are seen as better aligned with automation outcomes than seat-based models tied to headcount. Firms with deep datasets and integrated ecosystems may also hold advantages. Current forecasts for sector revenues in 2026-27 remain flat, implying that acceleration may not arrive until later in the decade.
Figure 5: Global Software Total Addressable Market (USDT)
Click the image to enlarge
Figure 6: S&P 500 GIC Sector Software & Services (YoY Revenue Growth)
Click the image to enlarge
Source: HSBC AM, Morgan Stanley Research, September 2025. Past performance does not predict future returns
A particular focus is on "agentic Al" systems, designed to achieve goals and perform tasks rather than respond in simple input-output exchanges. The potential is significant, including productivity gains and market expansion. But limitations remain. Hallucinations in outputs, liability risks and performance constraints have been evident. Some early attempts at large-scale substitution of human labour with Al have already had to be reversed, with firms rehiring staff after disappointing results.
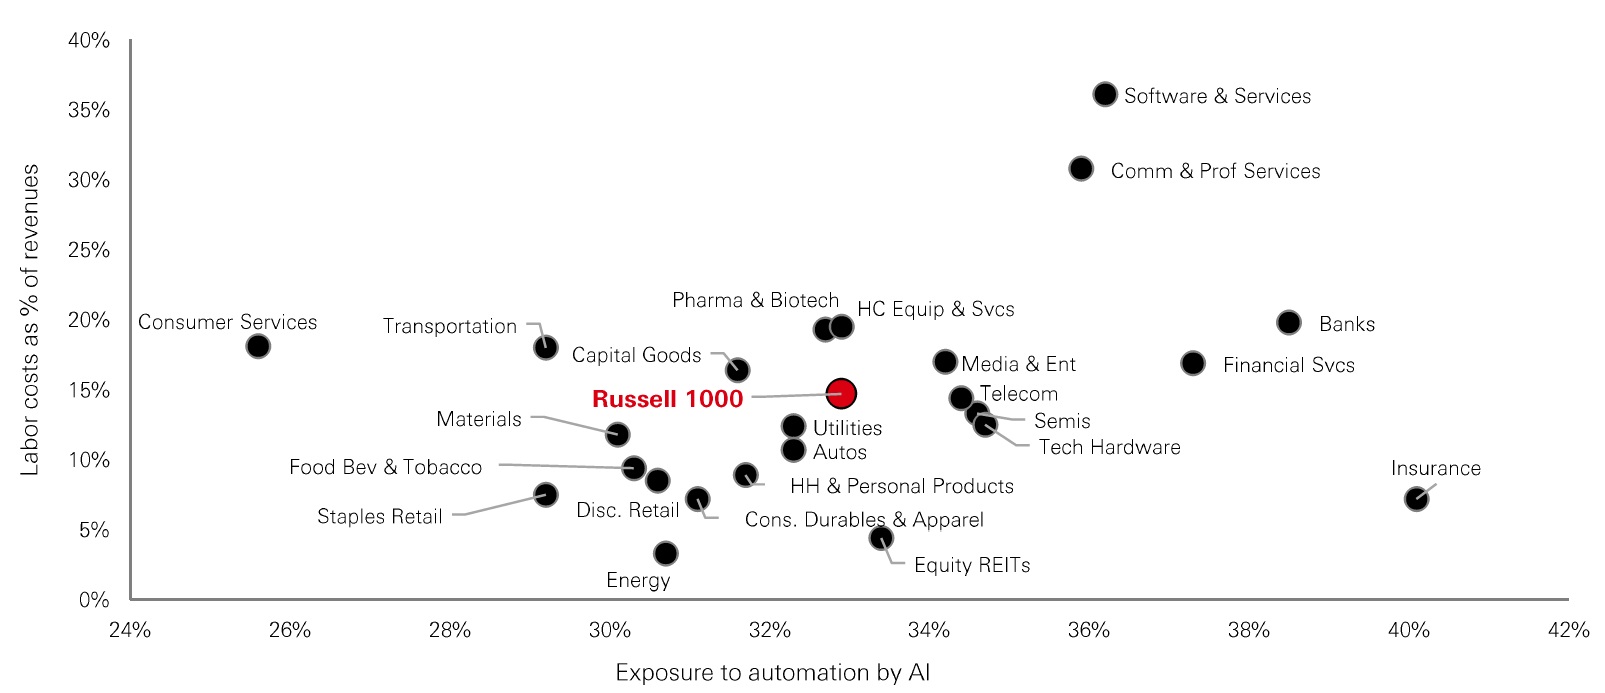
The third phase is broad adoption across the corporate landscape. So far computing, web hosting, publishing and broadcasting have been the earliest adopters. However, current penetration remains very low - estimates put adoption at around 10% of firms in the US. Barriers include data quality, privacy, and the lack of defined use cases. Even where adoption is being trialled, many companies remain in pilot mode, limiting any immediate credit impact. Nevertheless, the long-term trajectory is towards much more widespread integration, with corporate earnings calls increasingly referencing Al. More than half of S&P 500 firms mentioned it in recent quarters, though only a minority linked it directly to profits. Labour-intensive industries such as professional services and banking are expected to be the most obvious beneficiaries over time.
Figure 7: Exposure to automation by Al vs. labour costs as % of revenues (Russell 1000 industry median)
Click the image to enlarge
Source: HSBC Asset Management, Goldman Research, October 2025.
Al adoption faces the challenges of unmet expectations and complex enterprise adoption, while the scale of funding and diverse regulatory approach raise questions as to whether the technology will make returns on the vast sums invested and the financial risks inherent in overinvestment. Although we believe this situation has better debt characteristics than the Dotcom bubble and the GFC, we need to monitor these risks carefully in the coming years.
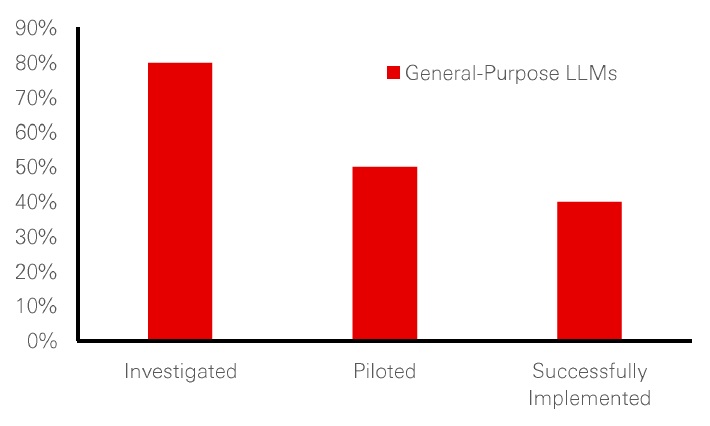
The speed of adoption and general euphoria around everything to do with Al have generated expectations which have not always been matched by outcomes. Surveys and industry reports point to a large share of Al projects failing to generate meaningful return on investment. In many cases, budgets have been directed toward visible functions such as marketing rather than towards back-office areas where automation may deliver stronger results. Static models that do not adapt to changing needs have further constrained performance.
While enterprises work through these challenges, individual employees have often adopted consumer Al tools informally, highlighting a contrast between grassroots use and corporate deployment. Moving from consumer-level familiarity to enterprise-scale implementation requires overcoming legal, technical and organisational hurdles, making the process more complex than initial enthusiasm suggested.
Figure 8: Most Al pilots fail to scale
Click the image to enlarge
Figure 9: Budget allocations
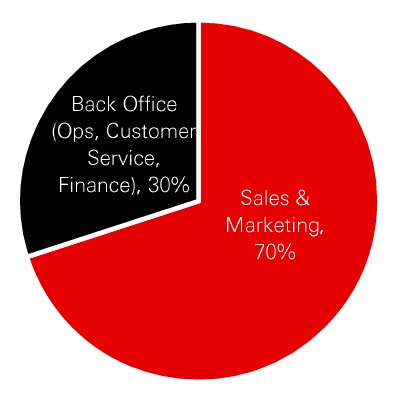
Click the image to enlarge
Source: HSBC AM, MIT, McKinsey, Gartner, Toms Guide, October 2025.
The pace of current spending is on Al projects is striking. Al-related capital expenditure is set to account for around 2 per cent of global GDP in 2025, a level comparable to the telecommunications build-out of the early 2000s, while in the first half of 2025 alone, Al contributed more to global GDP growth than all consumer spending combined.
Figure 10: Mag 7 40x P/E is well above the S&P 500
Click the image to enlarge
Source: HSBC AM, Bloomberg, U.S. Council for Economic Advisors, Ed Canard, September 2025. Past performance does not predict future returns.
That said, while there are parallels with past episodes, there are also significant differences worth noting. Demand for Al infrastructure continues to outpace supply, providing ongoing momentum. The largest providers have also relied primarily on internal cash flows to fund expansion, limiting leverage concerns. Most of the companies involved in the build out of Al are established players rather than startups. The greater risk lies with infrastructure suppliers that are more dependent on revenue growth from Hyperscaler spending and operate with weaker credit profiles. A sharp cutback in capital expenditure by their clients would place these firms under strain. Another risk could arise from increased use of off-balance sheet funding as well as private markets, limiting the transparency.
Finally, Al's development is not only a market phenomenon but also a regulatory and geopolitical one. Europe has moved furthest with a comprehensive legal framework in the Al Act, which emphasises rights, transparency and safety. The United States has opted for a decentralised mix of guidelines, executive orders and state-level rules. China's approach emphasises efforts to build domestic capacity and reduce reliance on foreign technology.
Export restrictions on advanced chips and equipment have become a focal point in the contest between the US and China, while European firms remain central players in the global supply chain. This regulatory divergence reflects not only domestic policy choices but also intensifying geopolitical competition. Trade restrictions between the US and China are shaping the strategic landscape, while Europe positions itself as the most structured regulatory regime.
Source: HSBC Asset Management, October 2025. The views expressed above were held at the time of preparation and are subject to change without notice. Any forecast, projection or target where provided is indicative only and not guaranteed in any way. HSBC Asset Management accepts no liability for any failure to meet such forecast, projection or target.