Multi-Asset Insights
Key Highlights:
- The dominance of US equities is facing challenges from valuation pressures, fiscal constraints, and shifting global economic dynamics.
- The rest of the world is showing resilience, with attractive valuations and policy shifts creating opportunities for diversification. Europe and Asia have emerged as credible contenders.
- Emerging markets in Asia are increasingly attracting foreign portfolio investments, driven by domestic fundamentals, reflecting the region’s growing maturity and appeal as a source of diversification and defensiveness.
In a nutshell
A turning tide in global equity leadership
- The dominance of US equities, long bolstered by technological leadership and fiscal stimulus, is now being challenged by stretched valuations and shifting global economic dynamics
- While US equities remain a cornerstone of global portfolios, the emergence of a multipolar investment landscape highlights the importance of exploring opportunities beyond the US
- As a result, European equities and emerging markets are gaining traction. With attractive valuations and supportive policy shifts, these regions present compelling opportunities for diversification, potentially prompting a reassessment of asset allocations
Unpacking the pulse of foreign flows into EM Asia
- Emerging Asia is increasingly attracting foreign portfolio investments, driven by its evolving financial infrastructure, favorable demographic trends, and resilience to global economic shocks
- Equity flows in the region have shifted over time, with India and ASEAN markets demonstrating greater resilience during global crises compared to export-driven economies like South Korea and Taiwan
- Debt flows, on the other hand, have been more stable than equity flows, with ASEAN countries and China emerging as key recipients thanks to favorable policies and supportive market structures
- While global factors – such as the strength of the US dollar – remain significant drivers of these flows, domestic fundamentals like valuations and earnings growth are playing an increasingly important role
Diversification does not ensure a profit or protect against loss. The views expressed above were held at the time of preparation and are subject to change without notice. For informational purposes only and should not be construed as a recommendation to invest in the specific country, product, strategy, sector or security. Any forecast, projection or target where provided is indicative only and not guaranteed in any way. HSBC Asset Management accepts no liability for any failure to meet such forecast, projection or target.
A turning tide in global equity leadership
For over a decade, US equities have enjoyed undisputed dominance. However, we are now witnessing a sustained period in which the rest of the world is outperforming, emerging as a credible contender for market leadership.
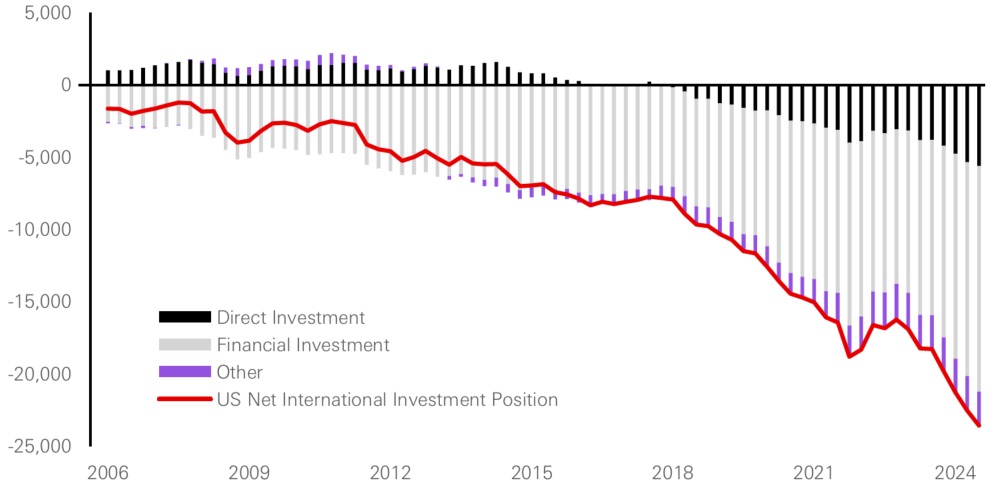
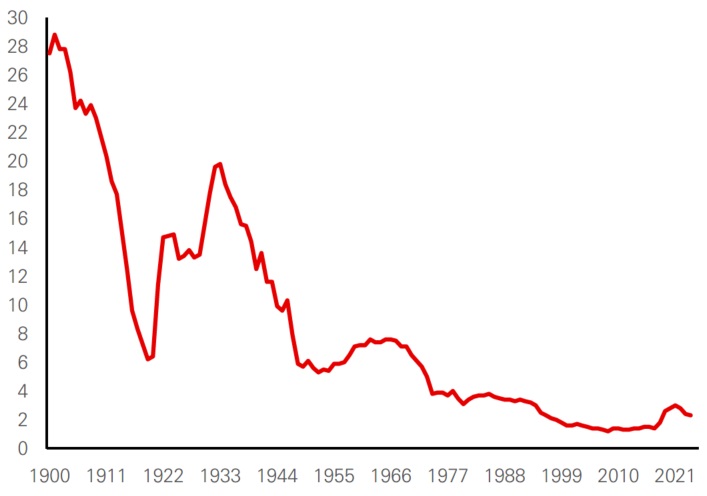
The era of ‘US exceptionalism’ has been sustained by a unique combination of factors, chief among them a robust post-crisis recovery, unmatched technology leadership, deep and liquid markets, and a generous fiscal policy regime. Perhaps most importantly, foreign enthusiasm for US equities defined the period post-2008 Global Financial Crisis (GFC) — central banks buying treasuries, institutional investors favouring the S&P 500, and retail enthusiasm for American growth stories, particularly in tech. This trend accelerated after 2018 and remained resilient even post-COVID, driven by global capital seeking a haven in the US growth and tech narrative. At the same time, the US has maintained a large current account deficit, effectively necessitating a persistent flow of foreign capital to fund consumption and fiscal spending.
Market's inertia and faith in the resilience of the US corporate machine is underscored by the US net international investment position data showing a sharp rise in foreign holdings of both US bonds and equities. The continued increase in US equity stakes resulted in foreign ownership tripling in just the last three decades and doubling over the last two decades. Yet, this trend also reflects a potentially saturated allocation.
Figure 1: US net international investment position (USD bn)
Click the image to enlarge
Past performance is no guarantee of future returns.
Source: HSBC AM, Bloomberg. Data as of May 2025.
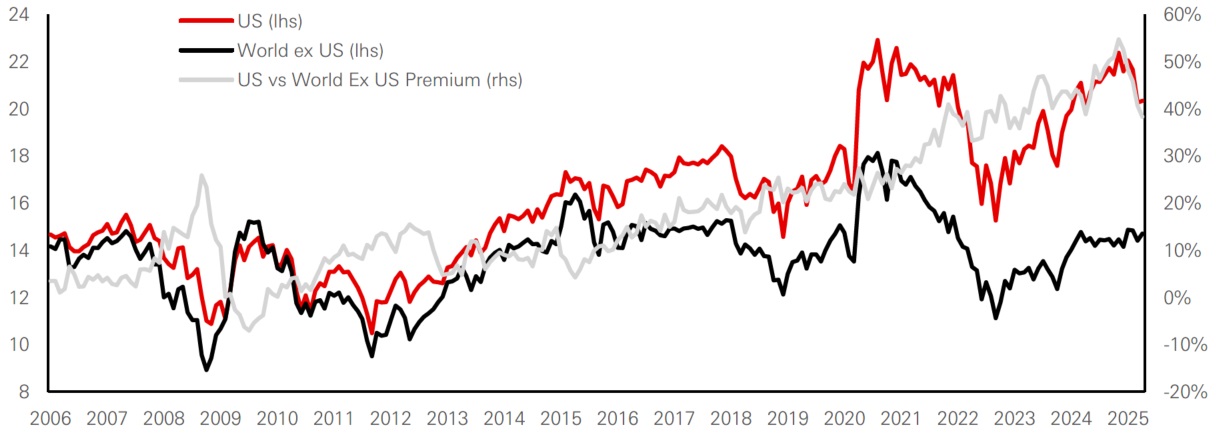
US equities now makes up approximately 70 per cent of the MSCI World Index, up from around 45–50 per cent twenty years ago. This dramatic expansion was driven by a steady influx of foreign capital. However, maintaining this dominance and sustaining valuation levels requires disproportionately large capital flows: for every dollar allocated to global equities, 70 cents must flow to the US. The economically significant share of inflows creates a systemic vulnerability to even minor reallocations, making this weighting no longer just a preference but a necessity for index-aligned global portfolios.
Figure 2: Share of MSCI World (USD)
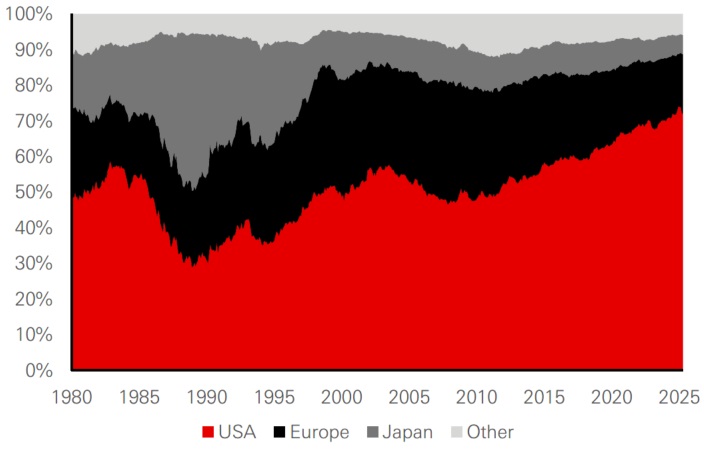
Click the image to enlarge
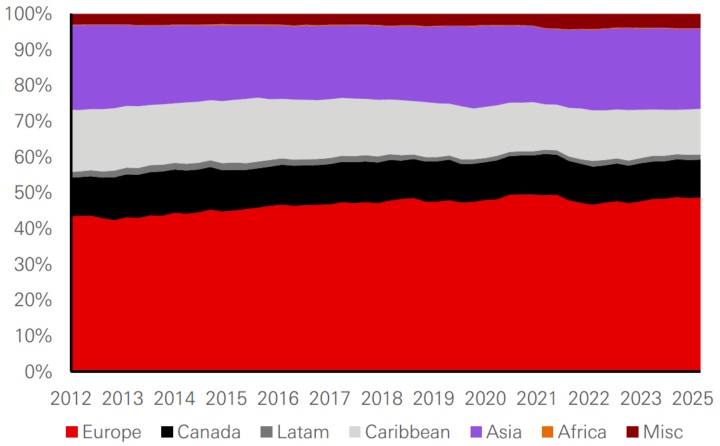
Figure 3: Share of foreign ownership of US equities
Click the image to enlarge
Source: HSBC AM, Bloomberg. Data as of May 2025.
Furthermore, from a regional perspective, European investors have increased their share of US equity ownership from the low 40 per cent range to nearly 48 per cent, while Asian investors have held relatively steady around 23–24 per cent. Canada and the Caribbean also held notable stakes, though the latter is primarily attributed to hedge fund structures. Despite minor reallocations after major policy events like Liberation Day, the long-term allocations remain deeply entrenched – suggesting any unwinding would be slow and potentially disruptive.
Valuations and divergence: The case for reversal
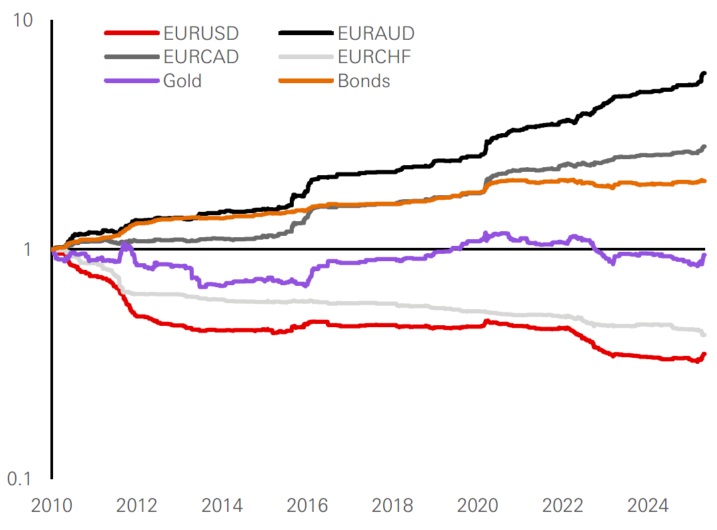
Historically, allocating to US equities has paid off handsomely. Whether measured in local currency or foreign exchange terms, the S&P 500’s consistent outperformance since the early 2010s made underweights to the US difficult to justify.
Figure 4: S&P 500 in foreign exchange terms
Click the image to enlarge
Figure 5: Local MSCI indices
Click the image to enlarge
Past performance is no guarantee of future returns.
Source: HSBC AM, Bloomberg, MSCI. Data as of May 2025.
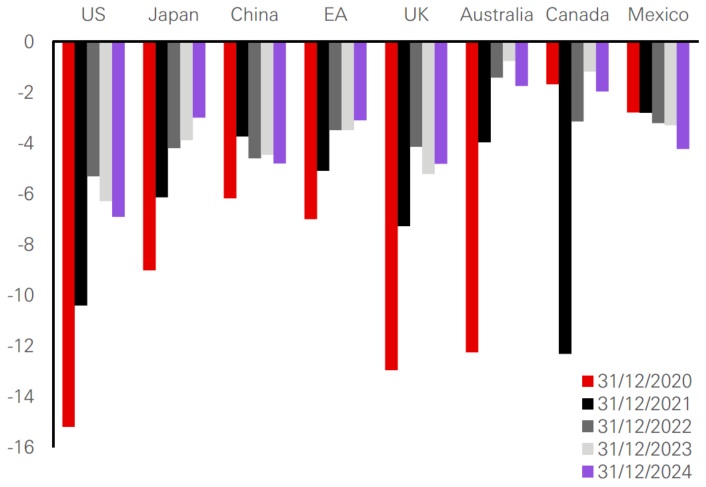
However, valuation spread now looks stretched, especially given the evolving fiscal and policy landscape. At the peak post-Trump election, the forward price-to-earnings (P/E) ratio for the S&P 500 was over 22, compared to 14-15 for the rest of the world. While some of this premium can be explained by superior earnings performance, particularly by the ‘Magnificent Seven’ US tech giants, it has also been fuelled by extraordinary fiscal support and government spending.
Figure 6: 12-month forward P/E ratios
Click the image to enlarge
Past performance is no guarantee of future returns.
Source: HSBC AM, Bloomberg. Data as of May 2025.
The US fiscal response post-Covid dwarfed that of most other nations, helping to justify investor optimism. Looking ahead, though, sustaining this level of fiscal largesse is increasingly unlikely. This leads to the expectations of a decline in year-on-year state-level spending in 2025 – a development not seen since the GFC.
Based on our estimates, if the valuation premium compresses in a difficult economic environment, the implications are substantial. Even without a change in earnings expectations, US equities would need to correct by approximately 15 per cent to normalise relative valuations. This aligns eerily with the April 2025 sell-off that followed the Liberation Day.Figure 7a: Estimated impact of EPS and P/E forecasts on equity market performance
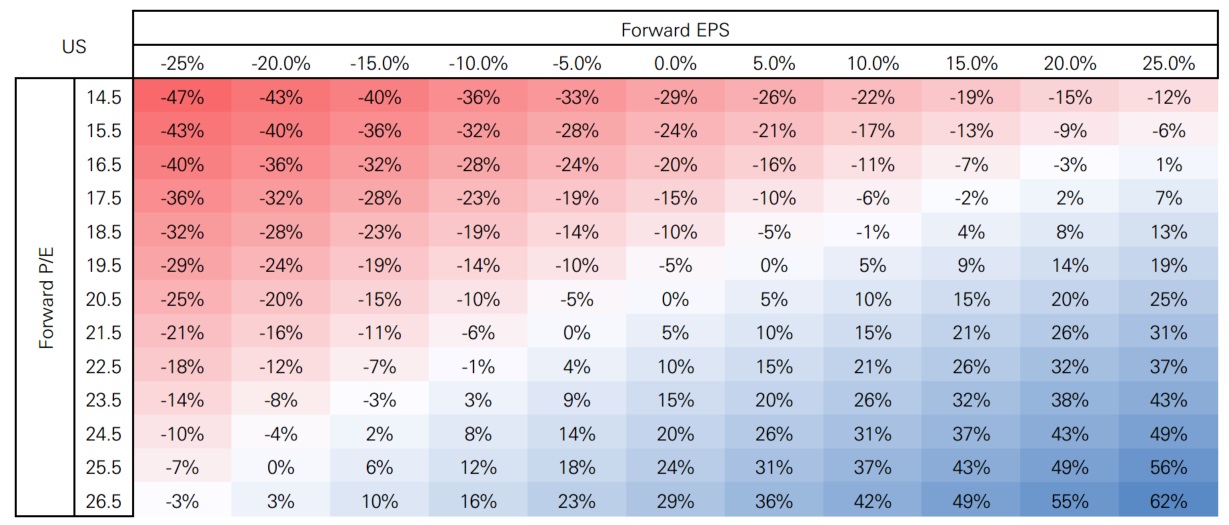
Click the image to enlarge
Source: HSBC AM, Bloomberg. Data as of May 2025.
Figure 7b: Estimated impact of EPS and P/E forecasts on equity market performance
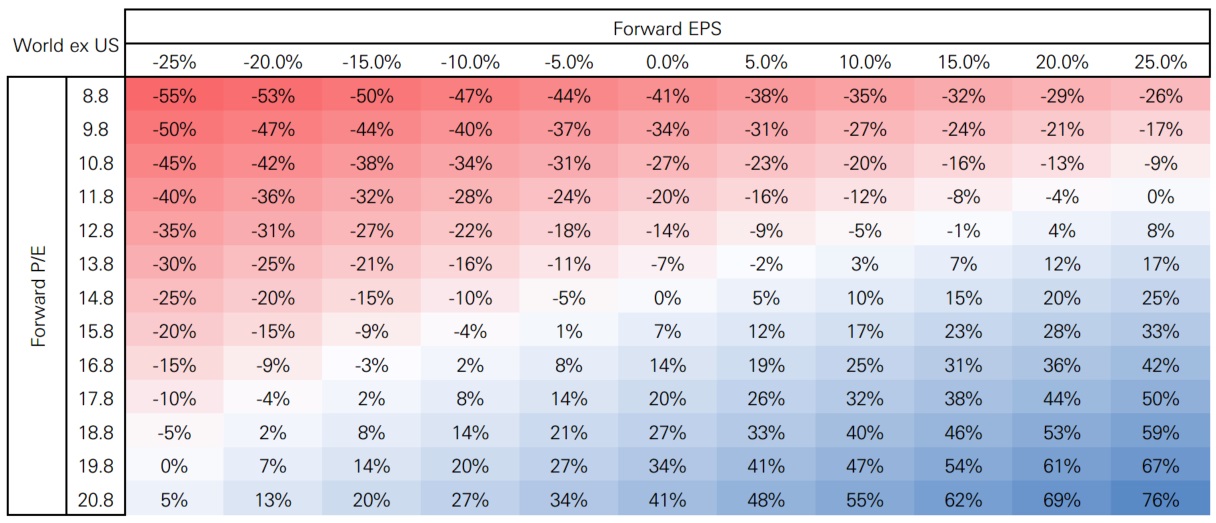
Click the image to enlarge
Source: HSBC AM, Bloomberg. Data as of May 2025.
It is essential to consider whether such adjustments mark the beginning of a structural rebalancing or merely a temporary aberration in an otherwise US-centric investment universe. While EPS resilience has historically justified US premiums, even modest re-ratings could create meaningful headwinds. Markets, as always, don’t necessarily react to absolutes but to marginal changes. A small shift in allocations – from 70 per cent US exposure in the MSCI World to even 67 per cent –could be enough to tip the scales.
Fiscal sustainability and the changing policy landscape
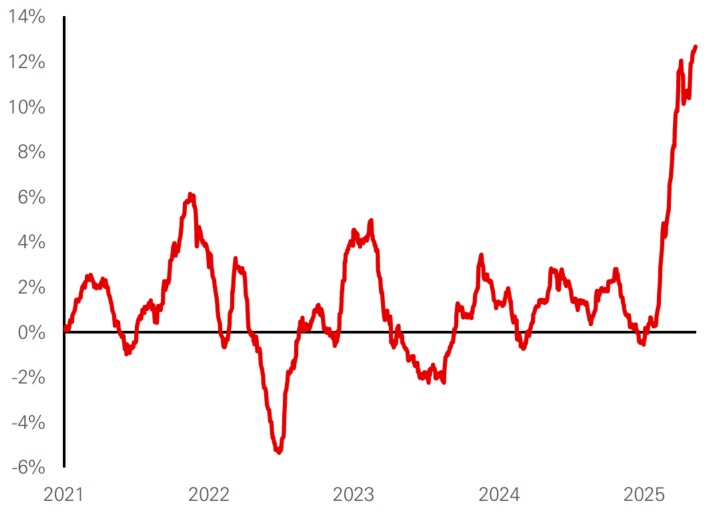
A central pillar of US exceptionalism has been large-scale fiscal spending. After the 2008 GFC and more recently during the COVID-19 pandemic, U.S. government spending surged – far exceeding the fiscal response in most other economies. This stimulus helped support both consumption and corporate profitability, directly contributing to the market’s sustained growth. Currently, however, this model appears increasingly unsustainable. As of early 2025, the US federal deficit remains near 7 per cent of GDP – a level rarely seen outside crisis periods. Cumulative fiscal deficit data through March suggests that 2025 could end up being the third-highest deficit year in history.
Figure 8: Cumulative deficits as a share of GDP since 2020 (per cent)
Click the image to enlarge
Figure 9: Cumulative US federal deficit by fiscal years (USD bn)
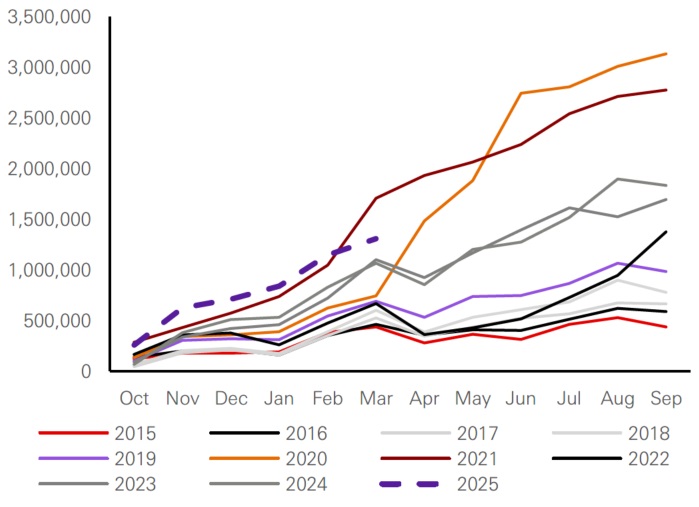
Click the image to enlarge
Source: HSBC AM, Bloomberg. Data as of May 2025.
While this still lends temporary support to equities, it raises concerns about long-term sustainability and fiscal discipline. At the state level, spending is now forecast to decline on a year-over-year basis in 2025 – an uncommon development since the GFC. This decline implies a reduction in public sector demand, which may weigh on private sector earnings and economic activity.
Meanwhile, fiscal policy in regions like the Eurozone is beginning to shift positively. Germany, for example, is moving toward a more balanced budget outlook, potentially creating a supportive backdrop for European equities. If other economies follow Germany’s lead, fiscal support outside the US could become a competitive advantage, rather than a disadvantage.
Another pivotal shift is the perceived end of the post-World War II global trade compact centred around US-led globalisation. The Liberation Day tariffs serve as a symbolic and economic pivot, challenging the assumption that the US will remain the world's demand engine indefinitely. If other countries begin to invest aggressively in domestic resilience and defence – as seems increasingly likely – this could tilt the fiscal and economic momentum in favour of Rest of the World (RoW) equities.
The role of tariffs and global realignments
Another factor now reshaping investor preferences is the resurgence of US protectionism. The effective tariff rate has climbed to nearly 3 per cent in 2025 – the highest in decades. Customs tax collections have surged since the Liberation Day policy announcements, marking a real, if delayed, economic impact from these measures.
Figure 10: US effective tariff rate (per cent)
Click the image to enlarge
Figure 11: US cumulative customs and excise tax collected (USD bn)
Click the image to enlarge
Source: HSBC AM, Bloomberg. Data as of May 2025.
While tariffs are aimed at supporting domestic manufacturing, they seem to act as a tax on consumption and investment, effectively withdrawing liquidity from the domestic economy. Over time, this could erode corporate margins and consumer purchasing power, particularly if retaliatory measures impact export demand. Importantly, the modern global economy is becoming less dependent on manufacturing. Today, services account for most value creation – over 55 per cent in China and as much as 75 per cent in developed economies. Still, the indirect effects of protectionism can permeate services through inflationary pressures and capital allocation disruptions.
Ironically, the country most vulnerable to protectionist fallout could be the US itself. While the headline economic impact may be delayed, market sentiment can shift quickly once the ramifications become clearer.
Market shifts in the rest of the world
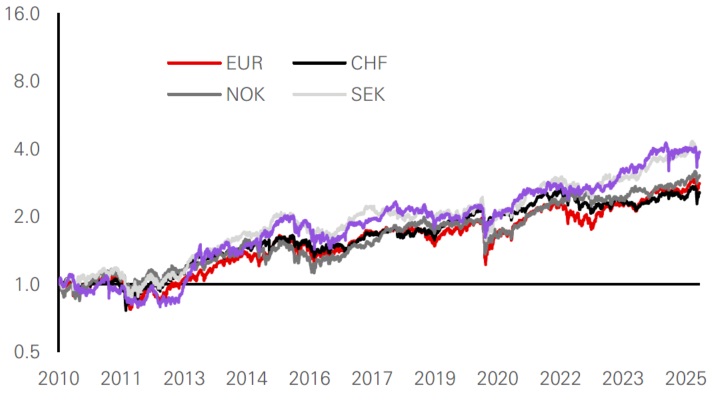
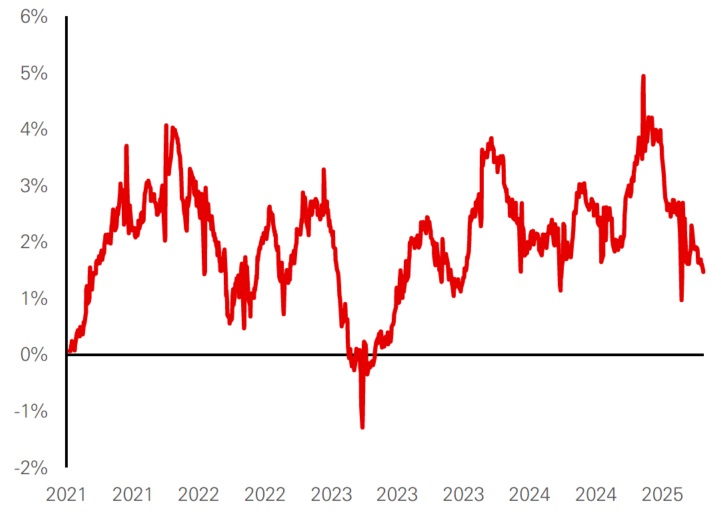
Globally, the Liberation Day shock introduced unexpected dynamics in both equity and currency markets. The US dollar, for instance, has shown relative weakness even as US equities rebound –an unusual divergence that merits close attention. The euro, in particular, has exhibited safe-haven characteristics, rallying during equity sell-offs and maintaining strength even as risk assets recover. This behaviour is far from usual, at least when compared to the past 15 years record where euro has rallied against cyclical currencies like Australian and Canadian dollar but not against the US dollar.
This change is even more pronounced when examining intraday currency behaviour. Post-Liberation Day, the yen and euro have moved substantially during Tokyo trading hours, suggesting shifting investor sentiment in Asia. The dollar’s weakness during these hours indicates a possible re-evaluation of US assets during non-US trading windows – a stark contrast to the historical pattern where S&P 500 movements led global investor sentiment.
Figure 12: Cumulative EUR moves when S&P 500 is down 1 per cent or more
Click the image to enlarge
Figure 13: Cumulative moves of the EUR/USD in 2025 split by hours
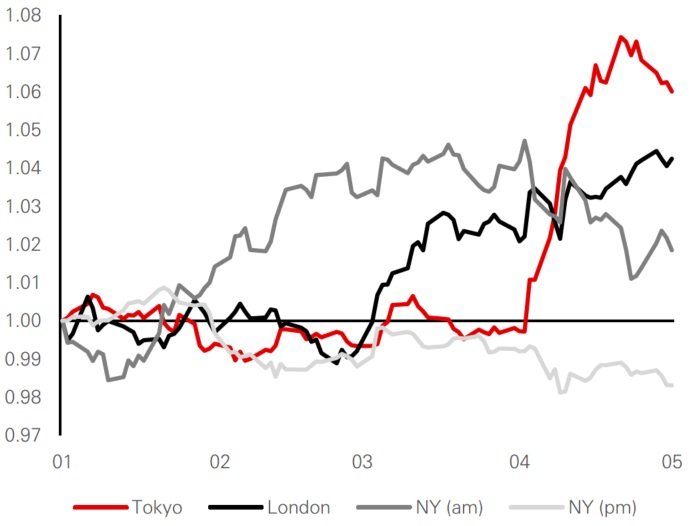
Click the image to enlarge
Source: HSBC AM, Bloomberg. Data as of May 2025.
Equity trading patterns offer further evidence of shifting tides. The S&P 500 has historically made the most moves during non-US trading hours, with US hours being relatively subdued. However, post-Liberation Day, the reverse has occurred: the index has sold off during Asian and European hours while holding up during US sessions. This suggests growing hesitance among foreign investors, even as domestic investors continue to buy dips – a behavioural divergence that could indicate the limits of US retail-driven resilience.
Figure 14: Cumulative returns of SPY split by hours
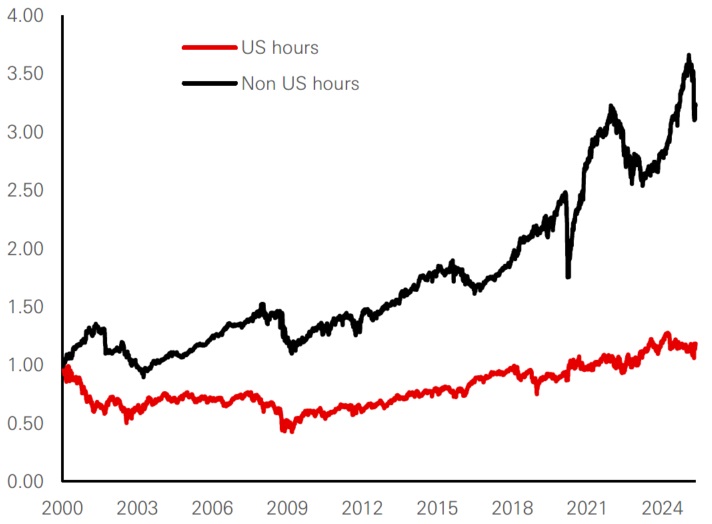
Click the image to enlarge
Figure 15: Cumulative returns of SPY in 2025 split by hours
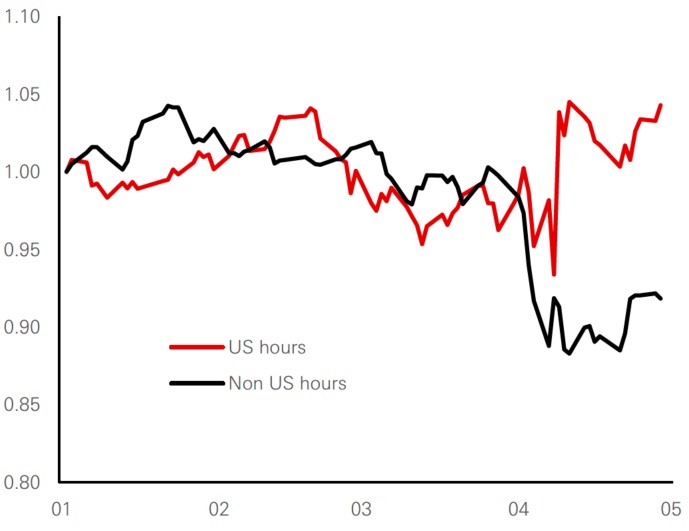
Click the image to enlarge
Past performance is no guarantee of future returns.
Source: HSBC AM, Bloomberg. Data as of May 2025.
Supporting this hypothesis is ETF flow data. While flows into US equity ETFs have slowed, they remain positive – indicating sustained, if cautious, domestic support. More striking, however, is the surge in flows into European equity ETFs. This is the strongest cumulative inflow into Europe-focused funds seen in at least five years. Although it is too early to declare a lasting trend, it may represent the early stages of a global reallocation.
Figure 16: Rolling 3m cumulative flows to US equities ETFs
Click the image to enlarge
Figure 17: Rolling 3m cumulative flows to European equities ETFs
Click the image to enlarge
Source: HSBC AM, Bloomberg. Data as of May 2025.
Investors may be rethinking the ‘US-only’ mindset that has dominated since the GFC. The question now is whether post-Trump rally levels mark a cyclical peak for US equities. Will tariffs and fiscal headwinds serve as a ‘wall of worry’ that markets overcome, or are they harbingers of a more sustained shift in leadership?
Emergence of a multipolar investment landscape
The case for US equity outperformance has been compelling for years, supported by tech leadership, fiscal spending, and global capital inflows. But the conditions that supported this exceptionalism are showing signs of strain – fiscal constraints, valuation excess, and emerging geopolitical shifts are all contributing to a more balanced investment landscape.
This is not a call to abandon US equities altogether. Rather, it is a recognition that US dominance may be entering a pause or adjustment phase. For instance, US technology companies continue to benefit from scale, platform economics, and innovation in AI and cloud infrastructure. Yet, there may be new alternatives that could be worth exploring.
Moreover, the strength of many cloud platforms is contingent on the health of small-to-medium enterprises that use their services. A downturn in US economic activity could reduce demand, even for dominant technology firms. Thus, while the US still leads in innovation, the durability of earnings across the sector could be tested in the next phase of the cycle.
This creates a strategic opportunity for investors to diversify, explore undervalued markets in Europe and Asia, and rebalance global equity exposure. The world outside the US is showing a more balanced fiscal discipline, more attractive valuations, and increasingly assertive policy responses. As the cycle matures, re-engaging with RoW equities may offer not only diversification but also performance upside. Eventually, should valuations normalise and macro risks recede, the US could once again become a prime destination for capital.
For now, however, the Liberation Day shock may have served as a wake-up call, shaking investors out of complacency and prompting reconsideration of allocation strategies. Whether the momentum appears to favour a broader and more global approach to equity investing will depend on the interplay of policy responses, economic resilience, and investor psychology. But one thing is clear: the rest of the world is no longer just a laggard in the shadow of US exceptionalism. It is emerging as a credible contender for leadership in the next chapter of global markets.
Unpacking the pulse of foreign flows into EM Asia
Foreign portfolio flows in Asia, once driven solely by global cycles, now reflect domestic fundamentals like valuation, earnings, and interest differentials, highlighting a maturing investor perspective.
As detailed in the previous section, the long arc of US exceptionalism has begun to bend, driven by structural deficits, policy-driven protectionism, and stretched valuations, which are catalysing a rotation in equity market leadership. This rotation is not just driven by relative valuations, but by macroeconomic realignments and geopolitical recalibration. Amid this backdrop, emerging Asia presents a compelling case for renewed scrutiny.
Asia's capital markets offer a litmus test for investor behaviour in a world where the US is no longer the default destination. A vital indicator to understand the investor sentiment, market’s structural maturity, and economic integration is the foreign portfolio investments (FPI) into equity and debt markets (referred to as ‘Portfolio Equity’ and ‘Portfolio Debt’).
FPI, unlike foreign direct investment (FDI), are highly responsive to short-term global dynamics. They reflect risk perception, return differentials, and policy signalling. While these flows tend to be more volatile than FDI, they form an essential component of the capital account in a country’s balance of payments and offer insights into a market’s structural maturity.
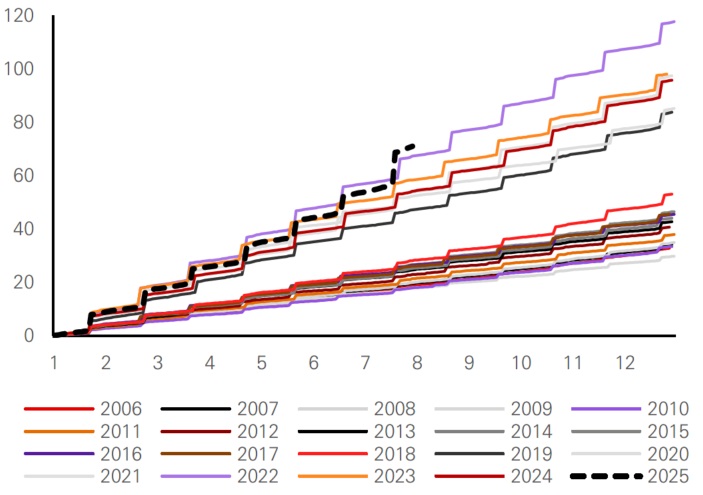
Over the past 25 years, cumulative FPI activity has provided not only liquidity to these markets but also reveal patterns of both resilience and vulnerability to global economic forces. A closer analysis shows the contribution of global volatility, domestic fundamentals, and policy divergence to shaping capital movements in this dynamic region.
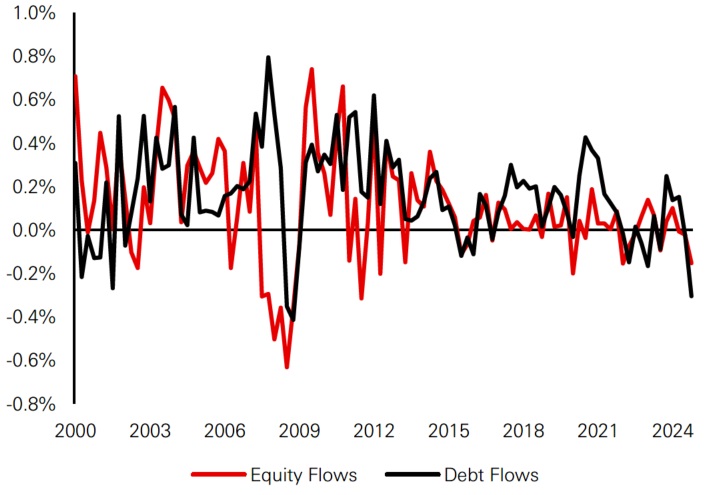
Figure 1a: Portfolio equity net flows (USD billions)
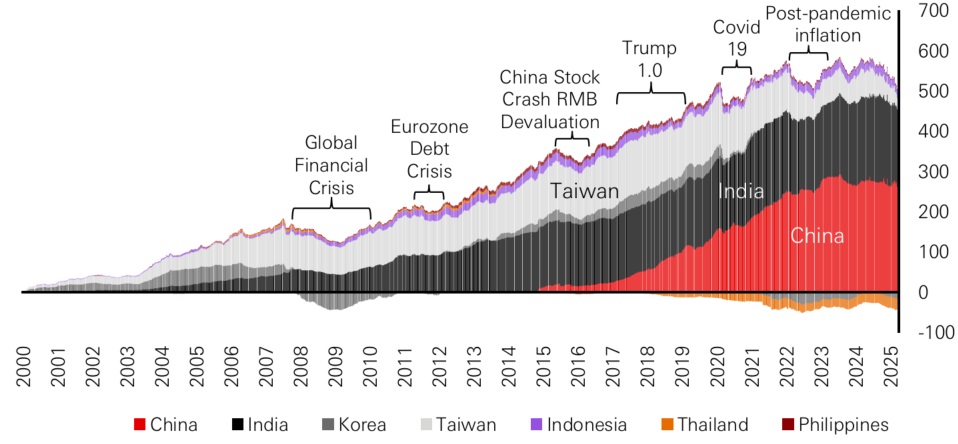
Click the image to enlarge
Note: China data only begins in November 2014. Source: Institute of International Finance, May 2025.
Figure 1b: Portfolio debt net flows (USD billions)
Click the image to enlarge
Note: China data only begins in January 2015. Institute of International Finance, May 2025.
From 2000 to 2024, foreign portfolio equity flows into emerging Asia have shown distinct trends and regime shifts. Early in the 2000s, Taiwan and South Korea emerged as dominant recipients due to their rapid recovery engendered by tech-driven export booms following the Asian financial crisis. Their advanced industrial bases, particularly in semiconductors and electronics, attracted significant foreign investment.
Figure 2a: Portfolio equity net flows per market (USD billions)
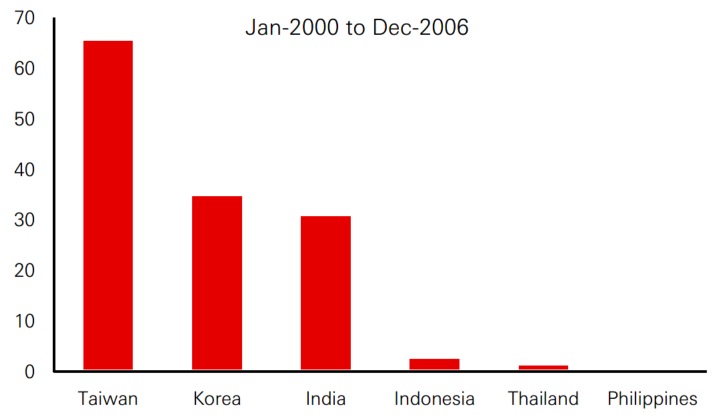
Click the image to enlarge
Click the image to enlarge
Note: China data only begins in November 2014. Source: Institute of International Finance, May 2025.
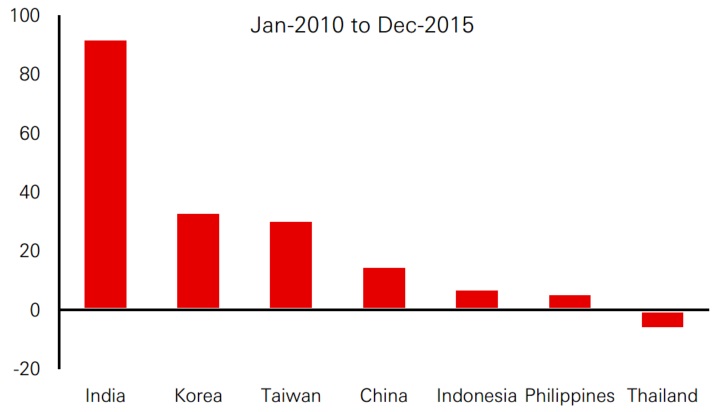
Between 2010 and 2015, India emerged as the new frontier, as it grew to match and eventually exceed the GDP of Taiwan and South Korea combined, attracting substantial foreign interest during the post-Global Financial Crisis low-interest rate environment. Foreign investors increased allocations to Indian equities, encouraged by its expanding domestic consumption base and market liberalisation.
The period post-2016 saw China become a key player following the launch of its Stock Connect program. Despite geopolitical tensions, including the US-China trade dispute, inflows into China remained resilient, likely due to the structural opening of its capital markets.
However, from 2023 to 2024, a slowdown became evident across the region. While India remained relatively attractive receiving moderate inflows, investor enthusiasm for China waned after a brief post-pandemic resurgence due to unfulfilled reopening expectations. Heightened uncertainty over US monetary policy and trade tariffs, also contributed to this region-wide cooling of sentiment.
Figure 2b: Portfolio Equity net flows per market (USD billions)
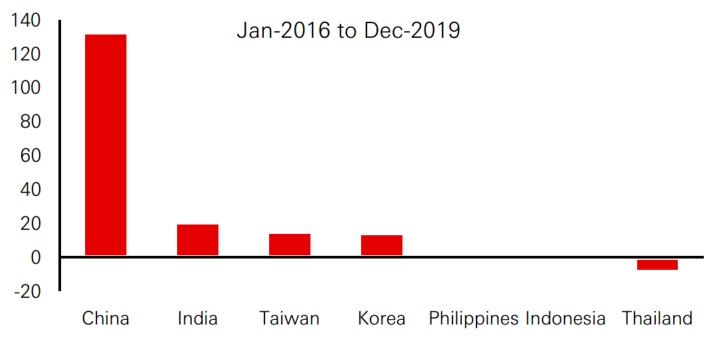
Click the image to enlarge
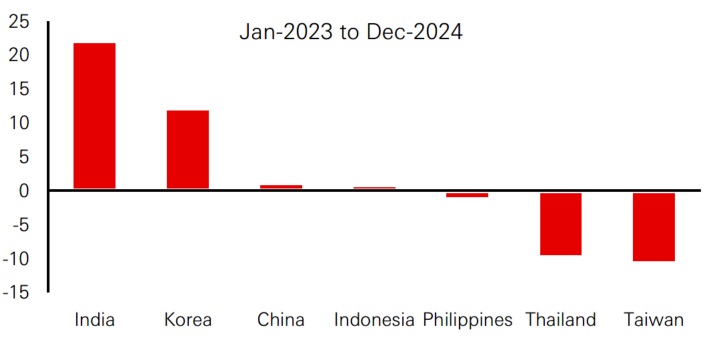
Click the image to enlarge
Note: China data only begins in January 2015. Institute of International Finance, May 2025.
When these equity flows are analysed during times of global crisis – particularly the 2007-2009 Great Financial Crisis and the 2020-2022 Covid pandemic – a stark difference in country responses is revealed. Export-driven economies like South Korea, Taiwan, and Thailand saw sharp outflows, especially during periods when their liquid markets made it easier for investors to withdraw. In contrast, India, Indonesia, and the Philippines demonstrated greater resilience during this time. With more domestically-driven growth models and less financial market openness, these economies provided a buffer against global risk-off sentiment.
Figure 2c: Portfolio Equity net flows per market
Cumulative Equity Flows Over GFC (per cent of GDP)
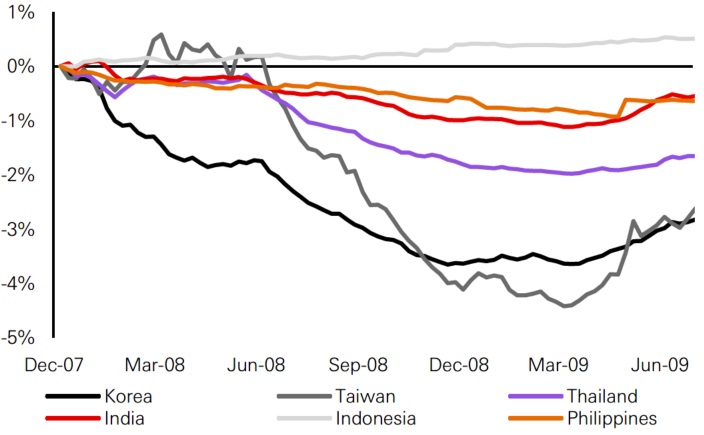
Click the image to enlarge
Cumulative Equity Flows over Pandemic (per cent of GDP)
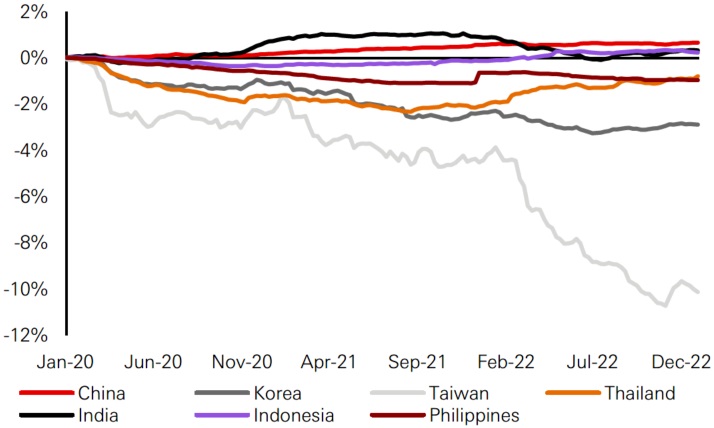
Click the image to enlarge
Note: China data only begins in January 2015. Institute of International Finance, May 2025.
During the pandemic, interestingly, China showed stronger resilience due in part to the domestic tilt of its A-share market and its relatively effective pandemic containment measures. The role of domestic investors and government intervention further supported price stability. Taiwan, which is heavily tied to global tech, suffered large outflows in 2022 when tech valuations fell.
These observations support the notion that countries with domestic consumption-oriented economies, like India and Indonesia, fare better during external shocks.
Portfolio Debt flows: More stability, different leaders
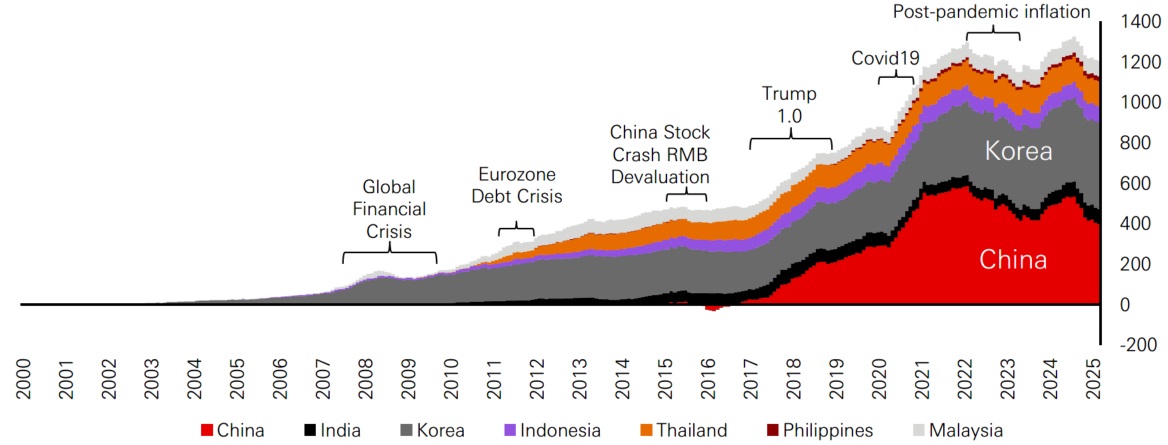
Compared to equity, portfolio debt flows displayed greater stability and a different pattern of regional distribution. In the early 2000s, South Korea was a major recipient due to its prolific bond issuance and integration with global financial markets. The ASEAN bloc – particularly Thailand, Indonesia, and Malaysia – followed, drawing substantial interest because of their favourable bond market structures and foreign-friendly investment policies.
Figure 3a: Portfolio Debt net flows per market (USD billions)
Jan-2005 to Dec-2016
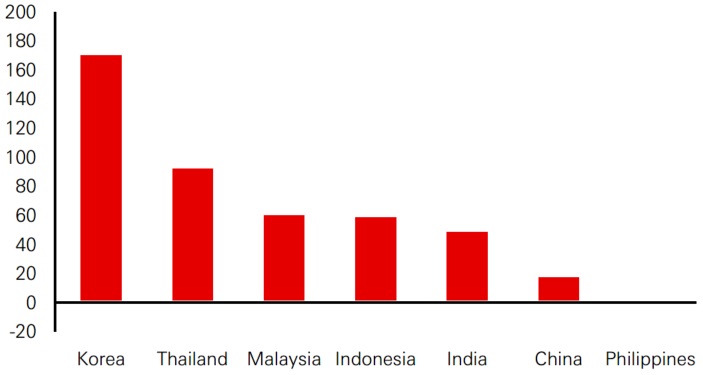
Click the image to enlarge
Jan-2017 to Dec-2021
Click the image to enlarge
Note: China data only begins in January 2015. Institute of International Finance, May 2025.
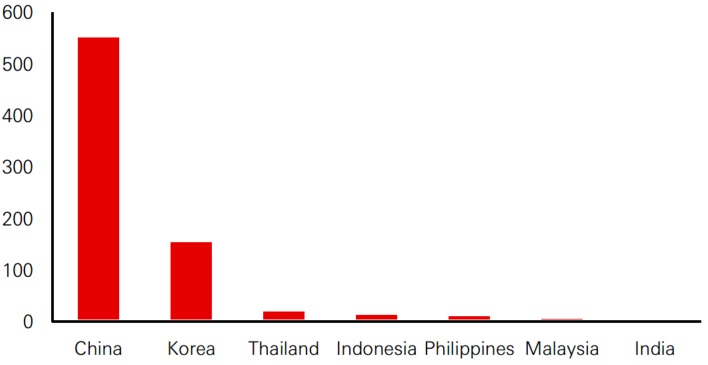
China’s bond market, on the other hand, emerged as a dominant force only after the 2017 launch of Bond Connect and inclusion in global bond indices by Bloomberg (2019), JP Morgan (2020), and FTSE (2021). However, in 2022 as global rates rose, countries like China and Indonesia maintained relatively loose monetary policy which led to relative yield erosion and outflows. Later in the year, though, Indonesia hiked rates to align with global tightening cycles, thus reversing the trend to see inflows return.
Figure 3b: Portfolio Debt net flows per market
Cumulative Bond Flows in 2022-2024 (per cent of GDP)
Click the image to enlarge
Quarterly portfolio flows to EM Asia (per cent of GDP)
Click the image to enlarge
Note: China data only begins in January 2015. Institute of International Finance, May 2025.
Over the entire period, cumulative debt flows have been almost twice that of equity flows, underscoring their more ‘sticky’ nature. Yet they remain susceptible to macroeconomic shocks, particularly policy divergence.
Determinants of Portfolio Equity flows: Global and domestic factors
Using a panel data regression model, our research team explored how global and domestic factors influence equity portfolio flows over the last 10 years. The selected global indicators encompassed:
- U.S. GDP and industrial production (business cycle indicators)
- Real effective exchange rates (REER) for USD, EUR, and JPY (trade competitiveness)
- Interest rate and yield curve differentials across major economies (monetary policy stance)
- M2 money supply (liquidity)
- VIX index (risk appetite proxy)
We have run our model on four groups:
- ASEAN 4 (Indonesia, Malaysia, Philippines, and Thailand): these countries display solid bond flow correlations due to consistent foreign participation and policy frameworks conducive to foreign bond ownership
- Korea and Taiwan: their equity flows are strongly correlated since both exhibit similar economic structures and market openness
- China and India: flows in these countries are poorly correlated, reflecting their differing economic identities i.e. China being export-oriented manufacturing driven versus India led by domestic consumption and services. Accordingly, these two countries have been analysed separately in our model
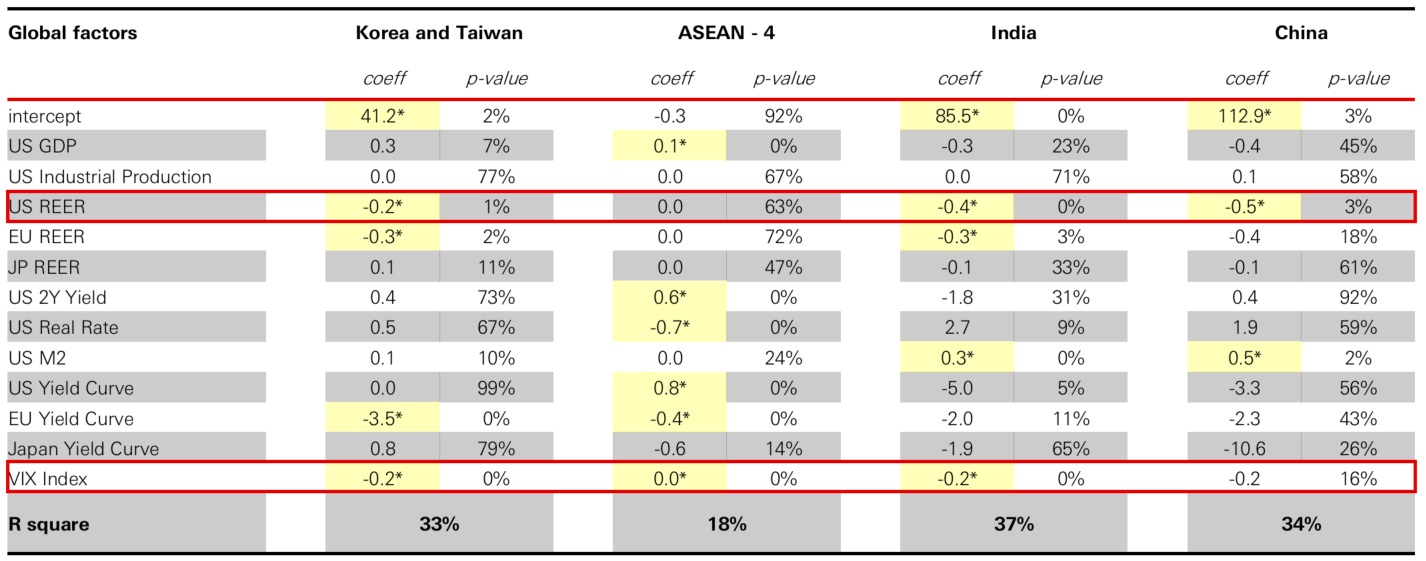
Figure 4a: Global factors
Click the image to enlarge
* Statistically significant at 5 per cent (p-value <5 per cent). Source: HSBC AM, May 2025.
Unsurprisingly, the VIX index emerged as a dominant factor with a negative impact – higher volatility leads to risk aversion and capital flight. The US REER was also having substantial impact, with a weaker dollar boosting flows into EM Asia.
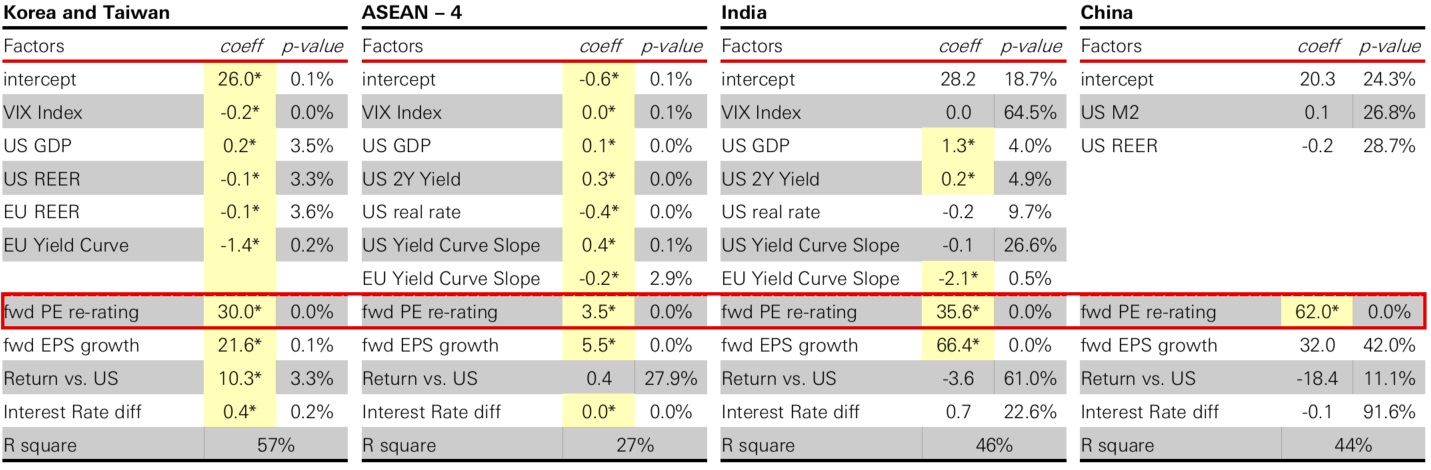
Furthermore, China’s onshore equity market was a notable outlier, showing minimal sensitivity to global risk factors. This is likely due to its low foreign equity holdings and supportive domestic policy actions, including government-backed purchases.Beyond global indicators, domestic factors such as forward-looking PE ratios, EPS growth, local equity returns, and interest rate differentials with the US also played major roles. The PE ratio was a common significant driver across regions, suggesting that valuation rerating attracts foreign capital. EPS growth was another key attractor of equity flows, particularly in India, Taiwan, and South Korea. Lastly, higher interest rate differentials were favourable for flows into ASEAN and North Asian debt markets.
Figure 4b: Local factors
Click the image to enlarge
* Statistically significant at 5 per cent (p-value <5 per cent). Source: HSBC AM, May 2025.
Liberation Day and post-shock market behaviour
The events post-Liberation Day witnessed a spike in the VIX. This resulted in substantial outflows from North Asian markets like South Korea and Taiwan, which are highly sensitive to both equity returns and global volatility.
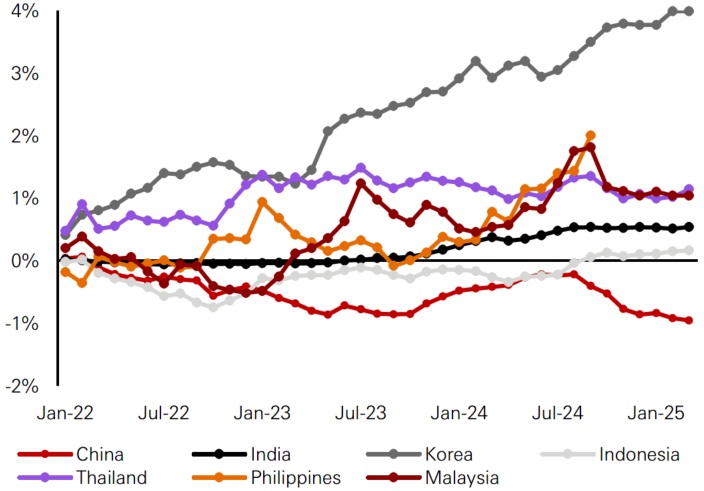
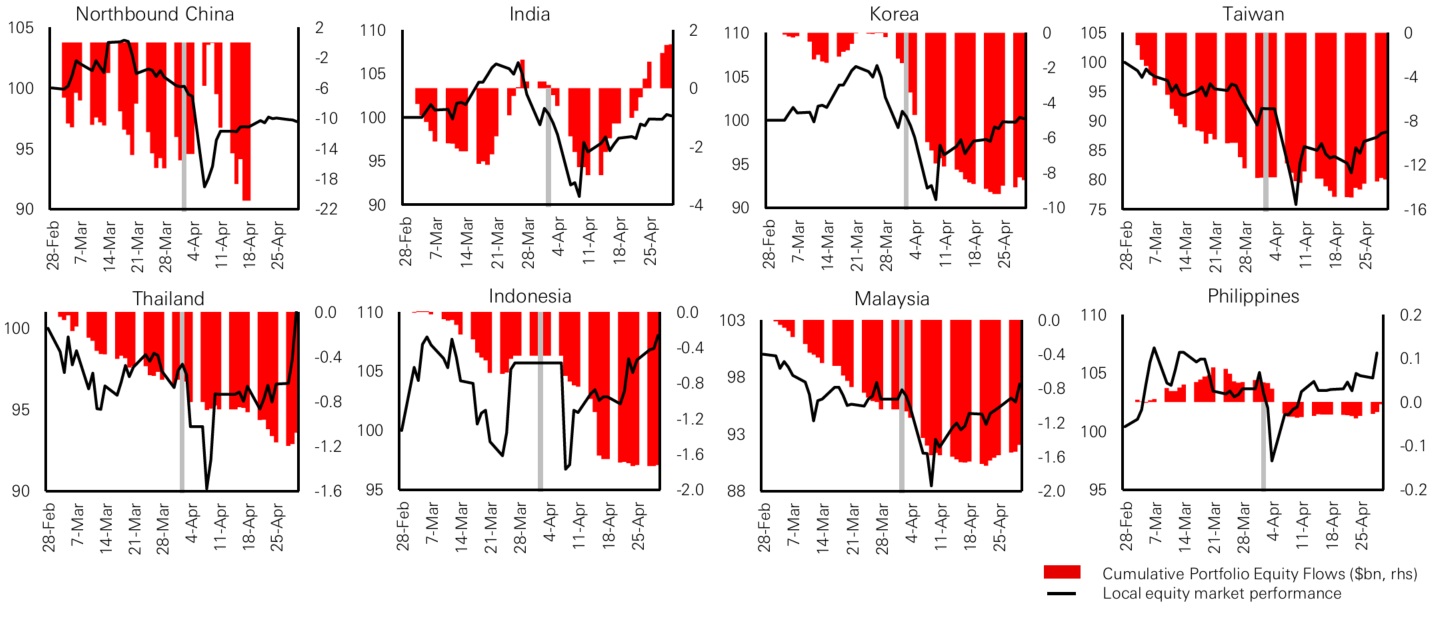
Following a 90-day pause in tariff implementation, markets began to stabilise. By late April 2025, flows into Taiwan, Korea, and ASEAN had reversed course, turning positive. India, in particular, emerged as a standout with quick recovery and inflows resuming from mid-April, highlighting its robustness in navigating global disruptions. This shift in flows highlight that the investor behaviour is not only reactive but also quickly responsive to policy moderation or easing of uncertainties.Figure 5: Portfolio Equity flows and market performance
Click the image to enlarge
Past performance is no guarantee of future returns.
Source: HSBC AM, Bloomberg. Data as of May 2025.
The views expressed above were held at the time of preparation and are subject to change without notice. Any forecast, projection or target where provided is indicative only and not guaranteed in any way. HSBC Asset Management accepts no liability for any failure to meet such forecast, projection or target.
Implications for investors and policymakers
This comprehensive 25-year review of foreign portfolio flows into emerging Asia offers several critical insights. From crisis-driven outflows to stimulus-fuelled surges and recent realignments amid policy shocks, the region continues to evolve in how it absorbs and responds to global capital. Foreign portfolio flows, once dictated by global cycles alone, are now influenced by domestic fundamentals – valuation, earnings, and interest differentials – which suggests maturing investor perspectives cannot be overstated.
While global risk sentiment and US dollar movements remain key triggers, Asia's capital markets offer more than diversification – they offer dynamism, differentiation, and increasingly, defensiveness. Resilience to shocks appears to be strengthening, especially in markets that have developed credible policy frameworks and domestic investor bases. China, for instance, has relative insensitivity to global risk reflecting both policy control and low foreign participation. India and ASEAN also stand out as examples of this evolution, showing that capital, once flighty, is now rewarding structural strength. North Asia including South Korea and Taiwan, while still vulnerable to global shocks, retains strategic importance via tech and trade.Ultimately, this evolution underscores the importance of balancing openness with safeguards, and global integration with domestic strength. As emerging Asia matures, both the patterns and implications of portfolio flows into the region will be essential for navigating this new equilibrium.
Source: HSBC Asset Management, May 2025. The views expressed above were held at the time of preparation and are subject to change without notice. Any forecast, projection or target where provided is indicative only and not guaranteed in any way. HSBC Asset Management accepts no liability for any failure to meet such forecast, projection or target.